
option = {
    tooltip:{
        trigger:"axis",
        textStyle:{
            color:"#FFF",
        },
    },
    xAxis: {
        type: 'category',
        axisTick:{show:false},
        axisLabel:{
            rotate:40  //控制文字倾斜
        },
        data: ['三门峡', '濮阳', '漯河','郑州', '平顶山', '南阳', '驻马店', '三门峡', '濮阳', '漯河']
    },
    yAxis: {
        type: 'value',
        axisLine:{show:false},
        axisTick:{show:false},
        max:1.2,
    },
    series: [{
        data: [0, 0, 0,0, 0, 0, 0.3,0,0,0],
        type: 'line',
        markPoint: { //图表标注
                data: [
                    {
                        type: 'max',
                        name: '最大值',
                        itemStyle:{ //自定义标注的颜色
                            color:"orange"
                        }
                    },
                    {
                        type: 'min',
                        name: '最小值',
                        itemStyle:{ //自定义标注的颜色
                            color:"green"
                        }

                    }
                ],
                label:{
                    position:"insideTop" ,//标注文字位置
                    distance:3 //距离图形元素的距离
                },
                symbolSize:[40,32],
                symbolOffset: ['26%', '-50%'], //图标偏移
                animation:true,
                // symbol: 'path://m 0,0 h 48 v 20 h -30 l -6,10 l -6,-10 h -6 z', // 'circle', 'rect', 'roundRect', 'triangle', 'diamond', 'pin', 'arrow', path://m 0,0 h 48 v 20 h -30 l -6,10 l -6,-10 h -6 z,  path://m 0,0 h 48 v 20 h -34 l -6,10 l -6,-10 h -2 z
                // symbol:"image://https://ss1.bdstatic.com/70cFuXSh_Q1YnxGkpoWK1HF6hhy/it/u=2318012298,1118210339&fm=26&gp=0.jpg"
                symbol:"path://M736 101.3H288c-123.2 0-224 100.8-224 224v149.3c0 123.2 100.8 224 224 224h37.3v224l256-224H736c123.2 0 224-100.8 224-224V325.3c0-123.2-100.8-224-224-224z"

        },
    }]
};
option = {
xAxis: {
type: 'category',
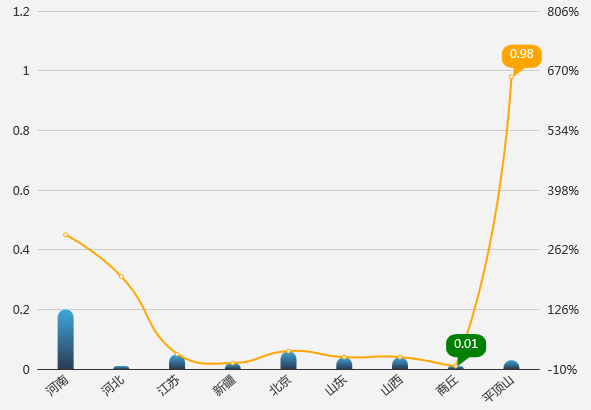
data: ['河南', '河北', '江苏', '新疆', '北京', '山东', '山西',"商丘","平顶山"],
axisTick: {show: false},
axisLabel:{
rotate:40,
}
},
yAxis:[
{
min:0,
max:1.2,
interval:0.2,
axisLine:{show:false},
axisTick: {show: false}
},
{
min:-10,
max:806,
interval:136,
axisLine:{show:false},
axisTick: {show: false},
axisLabel:{
formatter: '{value}%',
}
}
],
series: [
{
name:"本期",
data: [0.2, 0.01, 0.05, 0.02, 0.06, 0.04, 0.04,0.01,0.03],
type: 'bar',
barWidth:16,
barGap:0,
itemStyle:{
barBorderRadius:[10,10,0,0],
color: new echarts.graphic.LinearGradient(0, 1, 0, 0, [{
offset: 0,
color: "#293c55" // 0% 处的颜色
}, {
offset: 1,
color: "#3fa7dc" // 100% 处的颜色
}], false)
},
},
{
name:"同期",
data: [0.45, 0.31, 0.05, 0.02, 0.06, 0.04, 0.04,0.01,0.98],
type:"line",
smooth:true,
itemStyle:{
color: "orange"
},
markPoint: { //图表标注
data: [
{
type: 'max',
name: '最大值',
itemStyle:{ //自定义标注的颜色
color:"orange"
}
},
{
type: 'min',
name: '最小值',
itemStyle:{ //自定义标注的颜色
color:"green"
}
}
],
label:{
position:"insideTop" ,//标注文字位置
distance:3 //距离图形元素的距离
},
symbolSize:[40,32],
symbolOffset: ['26%', '-50%'], //图标偏移
animation:true,
symbol:"path://M736 101.3H288c-123.2 0-224 100.8-224 224v149.3c0 123.2 100.8 224 224 224h37.3v224l256-224H736c123.2 0 224-100.8 224-224V325.3c0-123.2-100.8-224-224-224z"
}
},
]
};