option = {
backgroundColor:"#293c55",
tooltip: {
trigger: 'axis'
},
legend: {
itemWidth:15, //设置legend图标的宽度
itemHeight:15, //设置legend图标的高度
right:60, //设置legend的位置
data: [
{name:"蒸发量",icon:"rect"},
{name:"降水量",icon:"rect"}
],
textStyle:{
color:"#fff"
}
},
calculable: true,
xAxis: [
{
type: 'category',
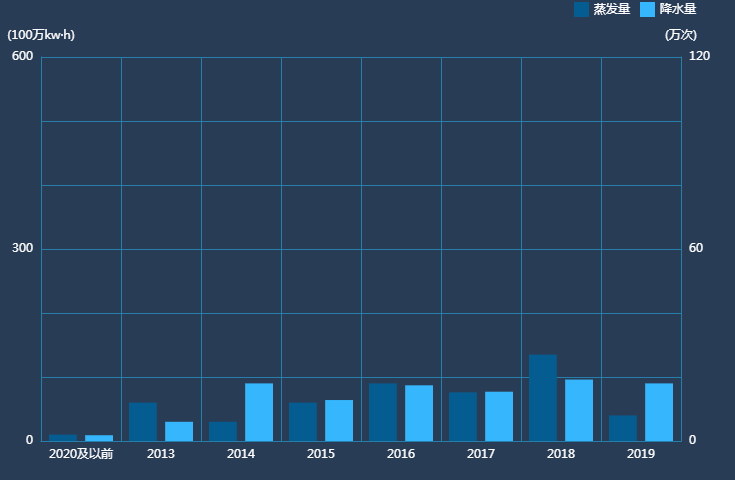
data: ['2020及以前', '2013', '2014', '2015', '2016', '2017', '2018',"2019"],
axisTick:{
show:false
},
splitLine:{ //设置分割线
show:true,
lineStyle:{
color:"#277eab",
1,
type:"solid"
}
},
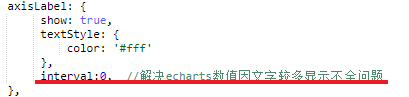
axisLabel: {
show: true,
textStyle: {
color: '#fff'
},
interval:0, //解决echarts数值因文字较多显示不全问题
},
axisLine:{ // 设置轴线是否显示
lineStyle:{
color:"#277eab"
}
}
},
],
yAxis: [
{
name:"(100万kw·h)",
max:600,
interval:100, //控制y轴的刻度
type: 'value',
axisTick:{ //控制y轴的刻度
show:false
},
axisLabel: {
show: true,
textStyle: {
color: '#fff'
},
formatter: function (value) { //定制y轴数据
var texts = [];
if(value==0){
texts.push('0');
}
else if (value ==100) {
texts.push('');
}
else if (value== 200) {
texts.push('');
}
else if(value== 300){
texts.push('300');
}
else if(value== 400){
texts.push('');
}
else if(value== 500){
texts.push('');
}
else{
texts.push('600');
}
return texts;
}
},
axisLine:{
lineStyle:{
color:"#277eab"
}
},
splitLine:{
show:true,
lineStyle:{
color:"#277eab",
1,
type:"solid"
}
},
nameTextStyle:{
color:"#FFF"
}
},
{
name:"(万次)",
min:0,
max:120,
interval:20, //控制y轴的分段
type: 'value',
axisTick:{
show:false
},
axisLabel: {
show: true,
textStyle: {
color: '#fff'
},
formatter: function (value) { //定制y轴数据
var texts = [];
if(value==0){
texts.push('0');
}
else if (value ==20) {
texts.push('');
}
else if (value== 40) {
texts.push('');
}
else if(value== 60){
texts.push('60');
}
else if(value== 80){
texts.push('');
}
else if(value== 100){
texts.push('');
}
else{
texts.push('120');
}
return texts;
}
},
axisLine:{
lineStyle:{
color:"#277eab"
}
},
lineStyle:{
color: ['#277eab'],
1,
type: 'solid'
},
splitLine:{
show:true,
lineStyle:{
color:"#277eab",
1,
type:"solid"
}
},
nameTextStyle:{
color:"#FFF"
}
}
],
series: [
{
name: '蒸发量',
type: 'bar',
data: [10, 60, 30, 60, 90, 76, 135,40],
itemStyle:{
color:"#045c91"
}
},
{
name: '降水量',
type: 'bar',
data: [9,30, 90, 64, 87, 77, 96,90],
itemStyle:{
color:"#36b6fd"
}
}
]
};
重点:
1、解决x轴因文字较多显示不全的问题:
2、定制双y轴数据
