安装准备
localhost:3000
user/password admin/admin
1.集成mysql数据源
安装mysql
-
新建数据源,支持mysql

数据库连接失败处理: https://www.jianshu.com/p/684bc3a77ac9 -
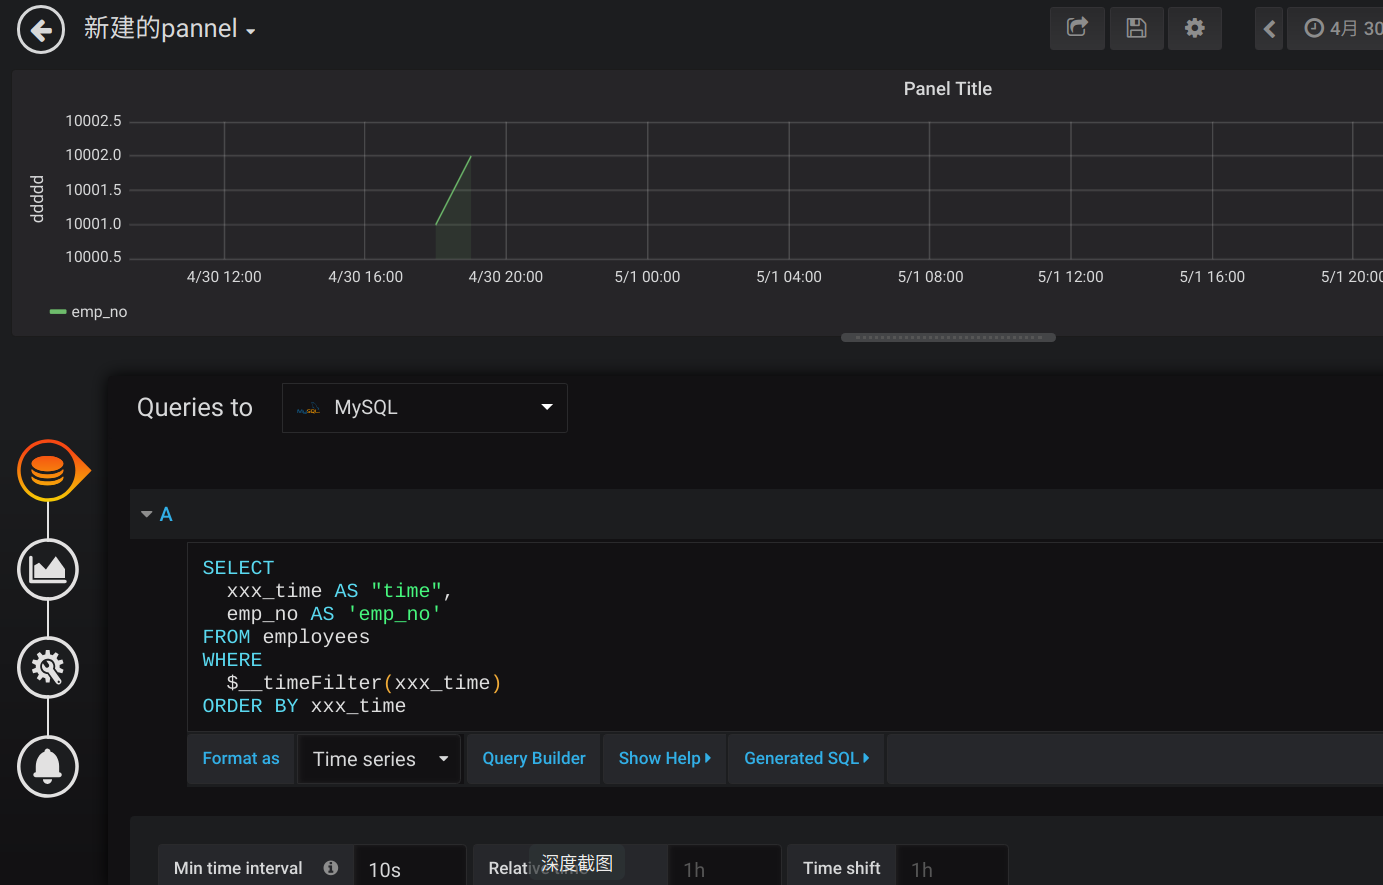
新建面板
配置sql查询语句。首次使用配置错误,左上角会有相应的提示信息
-
配置x,y轴单位与说明
grafana的主要作用是前端展示,自动到后台查询数据库或者API接口。 数据的采集还是需要自己写到数据库
更多高级操作: 查询联动...
遇到问题请google
https://github.com/grafana/grafana/issues/10950
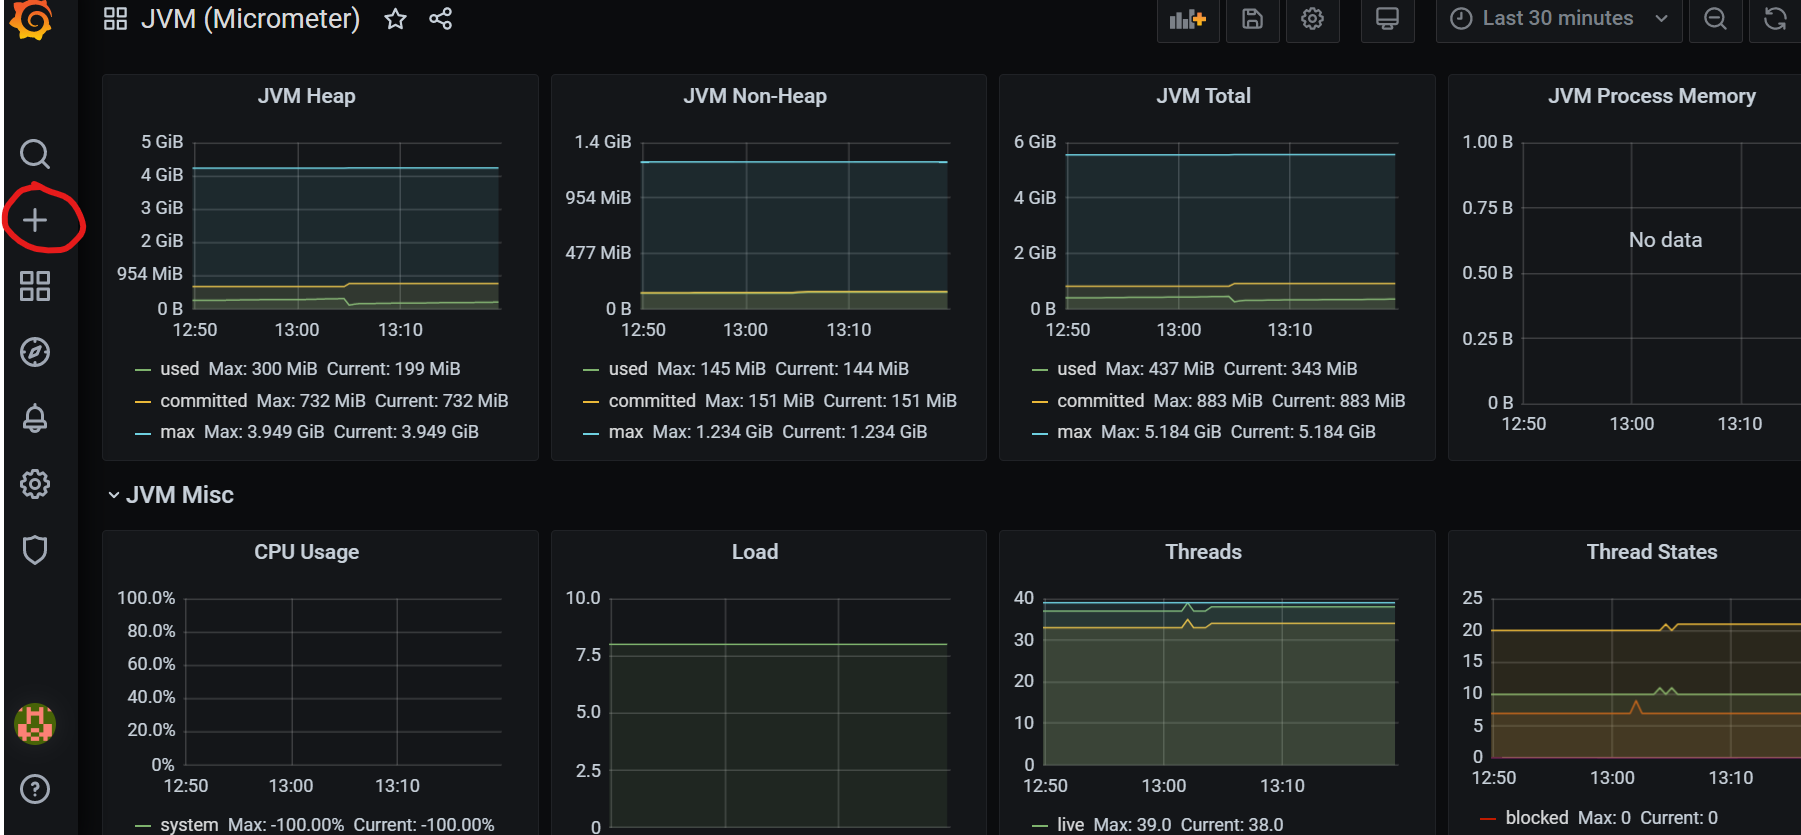
2.集成prometheus, 观察JVM指标
spring boot 2默认已经包含prometheus的jar,只不过jar是micrometer.io出品的micrometer-registry-prometheus, 不是google官方的
https://docs.spring.io/spring-boot/docs/current/reference/html/production-ready-features.html#production-ready-endpoints-security
<dependency>
    <groupId>org.springframework.boot</groupId>
    <artifactId>spring-boot-starter-actuator</artifactId>
</dependency>
<dependency>
    <groupId>io.micrometer</groupId>
    <artifactId>micrometer-registry-prometheus</artifactId>
    <version>${micrometer.version}</version>
</dependency>
grafana dashboard导入jvm模板