一.简介
主要使用matplotlib基于python的可视化组件实现。
二.代码实现
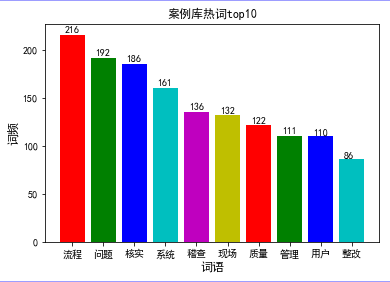
 1 # -*- coding: utf-8 -*-
 2 """
 3 Created on Mon Jul 13 09:55:30 2019
 4 @author: zhen
 5 """
 6 import numpy as np
 7 import matplotlib.pyplot as plt
 8
 9 plt.rcParams['font.sans-serif']=['SimHei']   # 用黑体显示中文
10 plt.rcParams['axes.unicode_minus']=False     # 正常显示负号
11
12 x = np.array(["稽查","流程","核实","问题","现场","质量","管理","用户","系统","整改"])  # x值取默认值
13 y = np.array([136, 216, 186, 192, 132, 122, 111, 110, 161, 86])
14
15 sortIndex = np.argsort(-y) # 倒序,返回排序后各数据的原始下标
16
17 x_sort = x[sortIndex] # 重新进行排序,与y保持初始顺序一致
18 y_sort = y[sortIndex] # 重新进行排序,倒序
19
20 #定义函数来显示柱状上的数值
21 def autolabel(rects):
22     for rect in rects:
23         height = rect.get_height()
24         plt.text(rect.get_x()+rect.get_width()/2.-0.25, 1.01*height, '%s' % int(height))
25
26 plt.xticks(np.arange(len(x_sort)), x_sort)
27 a = plt.bar(np.arange(len(x_sort)),y_sort,color=['r','g','b', 'c', 'm', 'y'])
28 autolabel(a)
29
30 plt.title('案例库热词top10')
31 plt.ylabel('词频', fontsize=12)
32 plt.xlabel('词语', fontsize=12)
33 plt.show()
三.结果