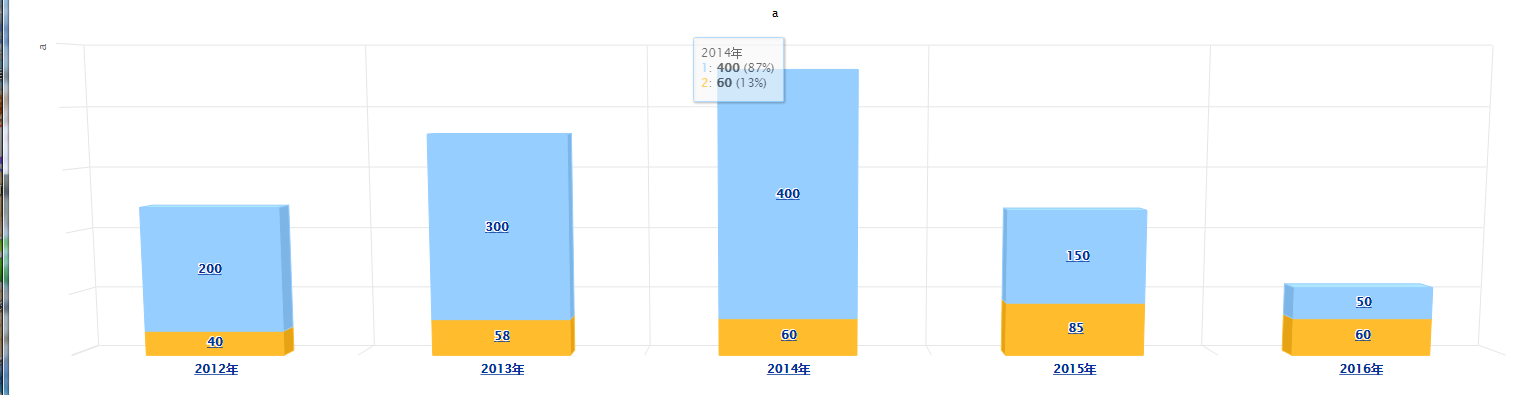
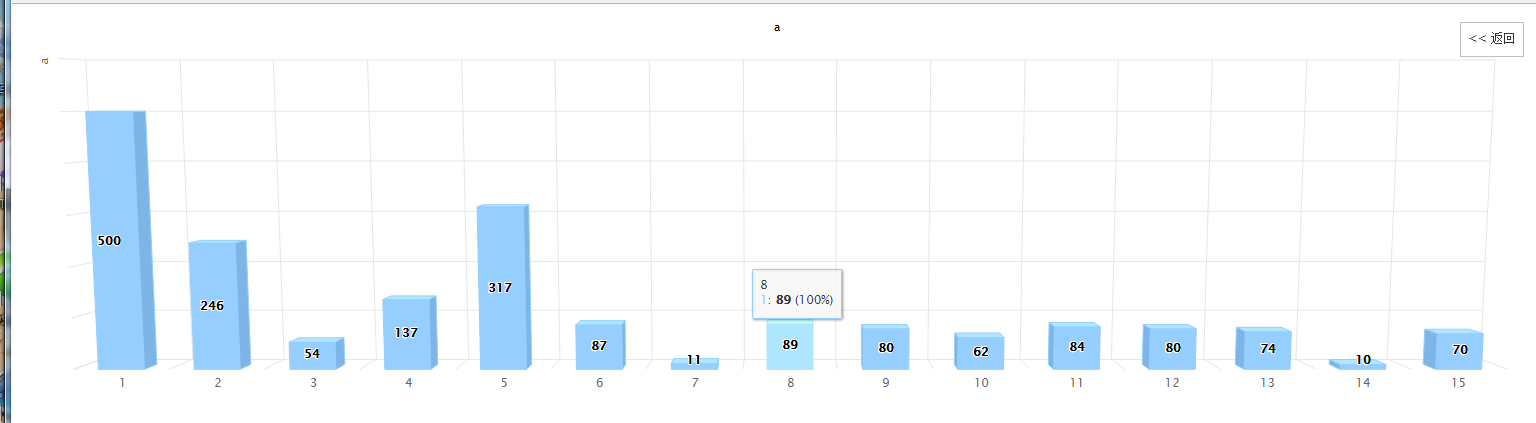
图片效果
***************代码部分******************************************************
<!doctype html>
<html>
<head>
<script type="text/javascript" src="http://cdn.hcharts.cn/jquery/jquery-1.8.3.min.js"></script>
<script src="http://cdn.hcharts.cn/highcharts/highcharts.js"></script>
<script src="http://cdn.hcharts.cn/highcharts/highcharts-3d.js"></script>
<script src="http://cdn.hcharts.cn/highcharts/modules/data.js"></script>
<script src="http://cdn.hcharts.cn/highcharts/modules/drilldown.js"></script>
<script type="text/javascript">
$(function() {
var global = {};
global.app = {};
global.ui = {};
Highcharts.setOptions({
lang: {
drillUpText: '返回'
}
});
var _data = [
["1", 500],
["2", 246],
["3", 54],
["4", 137],
["5", 317],
["6", 87],
["7", 11],
["8", 89],
["9", 80],
["10", 62],
["11", 84],
["12", 80],
["13", 74],
["14", 10],
["15", 70]
];
var _data2 = [
["1", 300],
["2", 296],
["3", 54],
["4", 177],
["5", 117],
["6", 74]
];
global.ui.chart = {
stackColumn: function(id, title, value, data, drilldownSeries) {
$(id).highcharts({
chart: {
type: 'column',
options3d: {
enabled: true,
alpha: 5,
beta: 0,
depth: 50,
viewDistance: 25
}
},
title: {
text: title,
style: "font-size:12px;"
},
xAxis: {
type: "category"
},
yAxis: {
min: 0,
title: {
text: value,
align: 'high'
},
labels: {
enabled: false
}
},
tooltip: {
pointFormat: '<span style="color:{series.color}">{series.name}</span>: <b>{point.y}</b> ({point.percentage:.0f}%)<br/>',
shared: true
},
plotOptions: {
column: {
stacking: 'normal',
dataLabels: {
enabled: true
},
showInLegend: false
}
},
credits: {
enabled: false
},
series: data,
drilldown: {
drillUpButton: _drillUpButton,
series: drilldownSeries
}
});
}
};
global.ui.chart.stackColumn("#container", "a", "a", [{
name: "1",
color:'#95ceff',
data: [{
name: "2012年",
y: 200,
drilldown: 'year'
}, {
name: "2013年",
y: 300,
drilldown: 'year'
}, {
name: "2014年",
y: 400,
drilldown: 'year'
}, {
name: "2015年",
y: 150,
drilldown: 'year'
}, {
name: "2016年",
y: 50,
drilldown: 'year'
}]
}, {
name: "2",
color:'#ffbd2e',
data: [{
name: "2012年",
y: 40,
drilldown: 'year2'
}, {
name: "2013年",
y: 58,
drilldown: 'year'
}, {
name: "2014年",
y: 60,
drilldown: 'year'
}, {
name: "2015年",
y: 85,
drilldown: 'year'
}, {
name: "2016年",
y: 60,
drilldown: 'year'
}]
}], [{
id: 'year',
name: "1",
data: _data
}, {
id: 'year2',
name: "2",
data: _data2
}]);
});
</script>
</head>
<body>
<div id="container" style="min- 310px; height: 400px; margin: 0 auto"></div>
</body>
</html>
********************************************************************
highCharts钻取功能官方教程地址:http://www.hcharts.cn/docs/basic-drilldown