先贴个图
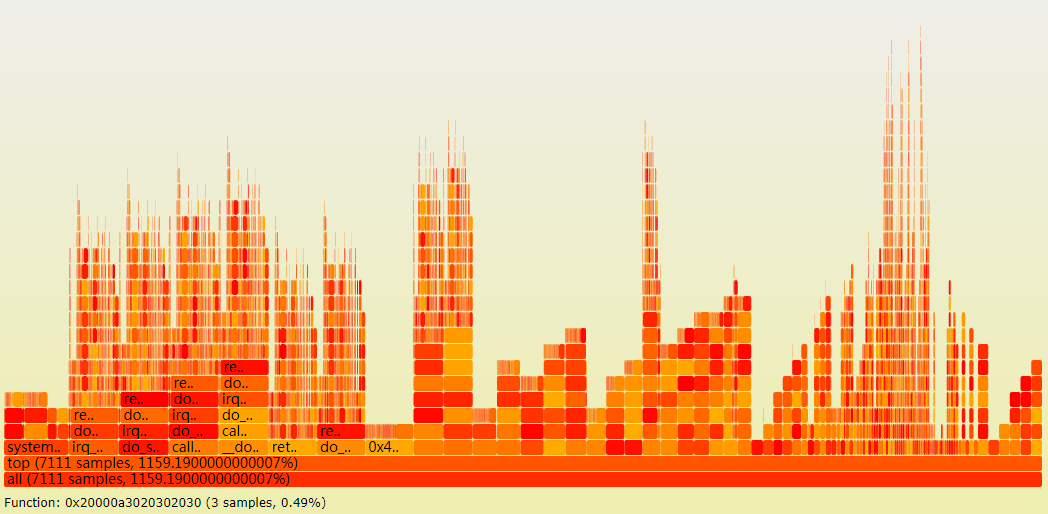
火焰图的应用场景
用于显示复杂的函数调用链,特点在于:数据量较大。
详细介绍可以参考阮大师的博客:http://www.ruanyifeng.com/blog/2017/09/flame-graph.html
本文主要在vue框架的基础上实现函数调用链火焰图,其它框架的实现方式类似,由于应用场景中的数据量较大,使用了三种方式来实现并测试该功能。
数据源格式:
函数调用链实质就是一棵树,最下层节点是根;上层节点的位置及宽度依赖于下层节点。
{
  id: {
    id: 'id_*', //使用字符串id,避免json.parse自动排序
    name: 函数名,
    percentage: 百分比,
    parentId: 父节点id,
    prevId: 兄弟节点id,
    level: 层级,
  }
}
计算方式:
根节点的宽度默认为100%宽度;
子节点宽度=调用百分比*父节点宽度;
位置信息x 从父节点的x开始,若前面有兄弟节点prev,则x = prev.x + prev.width;
位置信息y 从最底端开始,y = level * 16(每层火焰高度为15,间隔1像素)。
方法一:SVG多组件渲染方式
将一个节点作为一个组件实现
<svg width="100%" :height="height">
   <g v-show="!loading" id="graphContainer">
      <call-item v-for="item in items" :item="item" :key = "item.id" @mouseover="displayItem(item)" @mouseout="display=''"
        :parent="items['id_' + item.parentId]" @click="repaint(item)"
        :prev="items['id_' + item.preId]" :height="cHeight" :cur = "curItem"></call-item>
      <text x="15" :y="cHeight - 15" >{{display}}</text>
    </g>
</svg>
mouseover事件,在下册text区域显示鼠标滑动所至节点的详细信息
click事件,以被点击的节点为最大节点重绘调用链,其父节点均半透明,子节点根据当前节点宽度及位置信息重绘
单组件渲染方式在节点个数过大时效果较差
方法二:SVG单组件渲染方式
使用js拼凑火焰图部分作为模板来渲染,绘制部分和渲染部分如下:
   drawOneCallItem (item, frag, items) {
      let g = '', color = this.calcItemColor(),
        title = `${item.name}, ${item.percentage}%)`, display = title
      display = this.calcDisplay(title, item.width)
      g = `<g class="func_g">
      <title>${title}</title>
      <rect x="${item.pos.x}" y="${item.pos.y}" width="${item.width}" height="15.0" fill="${color}" rx="2" ry="2"
      orig-x="${item.pos.x}" orig-y="${item.pos.y}" orig-width="${item.width}" ></rect>
      <text x="${item.pos.x + 5}" y="${item.pos.y + 12}" >${display}</text>
      </g>`
      frag.push(g)
    },
    initFlameGraph () {
      console.info('starting getData:', new Date().getTime())
      if (this.id > 0) {
        this.depth = 0
        let frag = []
        service.getTree().then(({data}) => {
          let res = data.data
          let graph = document.getElementById('graphContainer')
          graph.innerHTML = ''
          for (let key of Object.keys(res.records)) {
            let item = res.records[key]
            this.drawOneCallItem(item, frag, res.records)
          }
          var MyAppendTo = Vue.extend({
            template: frag.join('')
          })
          let app = new MyAppendTo()
          app.$mount().$appendTo('#graphContainer')
          frag = []
          console.info('draw finish:', new Date().getTime())
        })
      }
    }
此方案在绘制1万+个节点时加上网络消耗大致需要2秒左右,基本符合需求。
方法三:Canvas实现方式
canvas 方式绘制性能非常好,实验过12万+的节点比方法二快3倍左右。但事件处理流程比较复杂,尤其是hover事件的模拟,计算量也比较大。
计算方式与方法二类似,预先计算好节点位置,然后从最底层按照宽度和位置信息按序绘制即可。
RoundedRect 类是canvas的单节点绘制类,原本是需要绘制圆矩形的,但宽度低时有问题,后面修改后再更新。
export default class RoundedRect {
  constructor (ctx, x, y, width, fill, text) {
    this.ctx = ctx
    this.x = x
    this.y = y
    this.width = width
    this.fill = fill
    this.text = text
  }

    // 画
  draw () {
    let ctx = this.ctx
    this.drawRoundedRect(ctx, this.x, this.y, this.width, 15, 0, this.fill, this.text)
  }

  calcDisplay (title, width) {
    let cLen = Math.ceil(width / 8) - 2,
      disStr = title
    if (title.length > cLen) {
      disStr = title.substring(0, cLen - 2)
      disStr = disStr.length > 0 ? disStr + '..' : disStr
    }
    return cLen <= 4 ? '' : disStr
  }

  drawRoundedRect (ctx, x, y, w, h, r, bgcolor, text) {
    ctx.beginPath()
    ctx.fillStyle = bgcolor
    ctx.fillRect(x, y, w, h)
    ctx.strokeText(this.calcDisplay(text, w), x + 5, y + 12)
    ctx.closePath()
  }
}
canvas方案的hover和click事件需要通过鼠标位置信息找到hover或click的是哪个节点,在节点很多时计算量也是相当的大啊,最后不得不放弃canvas方案。选择方法二。