pandas的小应用又来更新了(这次有用到一些新的函数),当前的测试报告中要求体现,个人BUG占比,各端BUG占比等等,这里只列举了BUG的2中统计维度
主要应用的是利用pandas处理excel中数据和整合数据后写入新的excel表格。(这次有结合了配置文件,还有封装成exe(使用更加方便))
1、类的初始化,主要是读取配置文件中的相关的内容,赋值变量,用于后面的函数作为参数使用


    def __init__(self):
        config = ConfigParser.ConfigParser()
        config.read("test.conf")   #读取配置文件

        self.BUG_File_Path=config.get("Excel","path")  #获取配置中Excel-path的值
        self.sheet_name = config.get("Excel","sheet_name")
        self.Development_Cycle =config.get("Excel","Development_Cycle")   #开发周期
        self.kehuduan_list =  config.get("executor_list","kehuduan_list")  #取各端的执行人分布-客户端
        self.yidongduan_list =  config.get("executor_list","yidongduan_list")
        self.houduan_list =  config.get("executor_list","houduan_list")
        self.qianduan_list =  config.get("executor_list","qianduan_list")
        self.product_list =  config.get("executor_list","product_list")
2、按照BUG的执行人划分,统计BUG的分布,以及计算个人的BUG占比
    def executor(self):
        #按照执行人,统计每个人的BUG总数,个人BRBP
        data=self.df['执行者'].values  #取出执行人这一列的所有数据
        executor_BUG = Counter(data)   #统计每个数据出现的次数

        executor_BUG1=sorted(executor_BUG.items(),key = lambda x:x[1],reverse = True)  #按照BUG数据倒序排列

        a=[['开发人员','开发周期','个人BRBP'],]
        for k,v in executor_BUG1:
            k1= k[0:k.rfind('(')]   #数据展示处理,只显示(前面的字符

            executor_BRBP =('%.0f%%' %((v/self.Development_Cycle)*100))    #计算个人BRBR:个人的BUG数/Development_Cycle(开发周期)*100%

            a.append([k1,v,executor_BRBP])   #将每一个人的数据添加到列表中,为写入excel表做准备
        return a
3、统计各端的一个BUG情况
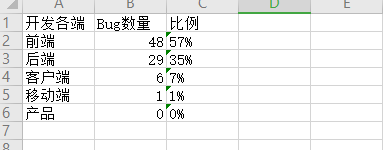
    def development_group(self,a_list):
        #根据执行者是属于哪个端的,统计各端的BUG总数,各端BUG占比
        a= a_list

        #将每个人的BUG数归属到每个端
        kehuduan_BUG = [a[i][1] for i in range(1,len(a))  if a[i][0] in self.kehuduan_list]
        yidongduan_BUG = [a[i][1] for i in range(1,len(a))  if a[i][0] in self.yidongduan_list]
        houduan_BUG = [a[i][1] for i in range(1,len(a))  if a[i][0] in self.houduan_list]
        qianduan_BUG = [a[i][1] for i in range(1,len(a))  if a[i][0] in self.qianduan_list]
        product_BUG = [a[i][1] for i in range(1,len(a))  if a[i][0] in self.product_list]

        #利用reduce()计算各端BUG的总数  (这里用了python的内置函数reduce,通过匿名函数,计算各端BUG的总和)
     注意:Python3.x reduce() 已经被移到 functools 模块里,如果我们要使用,需要引入 functools 模块来调用 reduce() 函数:

        kehuduan_BUG_total =reduce(lambda x,y:x+y, kehuduan_BUG,0)
        yidongduan_BUG_total =reduce(lambda x,y:x+y, yidongduan_BUG,0)
        houduan_BUG_total =reduce(lambda x,y:x+y, houduan_BUG,0)
        qianduan_BUG_total =reduce(lambda x,y:x+y, qianduan_BUG,0)
        product_BUG_total =reduce(lambda x,y:x+y, product_BUG,0)

        #计算各端BUG占总BUG数的百分比
        kehuduan_percent = ('%.0f%%' %((kehuduan_BUG_total/self.nows*100)))
        yidongduan_percent = ('%.0f%%' %((yidongduan_BUG_total/self.nows*100)))
        houduan_percent = ('%.0f%%' %((houduan_BUG_total/self.nows*100)))
        qianduan_percent = ('%.0f%%' %((qianduan_BUG_total/self.nows*100)))
        product_percent = ('%.0f%%' %((product_BUG_total/self.nows*100)))


        zu_list=[['客户端',kehuduan_BUG_total,kehuduan_percent],['移动端',yidongduan_BUG_total,yidongduan_percent],
                 ['前端',qianduan_BUG_total,qianduan_percent],['后端',houduan_BUG_total,houduan_percent],
                 ['产品',product_BUG_total,product_percent]]

        #按照百分比排序
        zu_list.sort(key = lambda x:x[1],reverse = True)

        zu_list.insert(0,['开发各端','Bug数量','比例'])
        return zu_list
4、将统计的数据写入excel中
    def to_excel_data(self):
        a= self.executor()
        b= self.development_group(a)

        data1 = pd.DataFrame(a)
        data2 = pd.DataFrame(b)

        nowTime = datetime.datetime.now().strftime('%Y-%m-%d')
        excel_name = "Report_data_"+nowTime+".xlsx"
        with pd.ExcelWriter(excel_name) as writer:
            data1.to_excel(writer,sheet_name='executor',header=None,index=False)
            data2.to_excel(writer,sheet_name='development_group',header=None,index=False)


        writer.save()
        writer.close()
5、最后一步,封装成exe
Pyinstaller -F -w BUG_analysis.py

双击exe文件就可以运行了。
6、举个栗子看效果 (按照其他维度统计BUG也是差不多的方式)
当前只是简单的数据式的统计,之后可以考虑视图式的,可以将BUG的情况通过图形的方式呈现,更加的直观