源自:https://blog.csdn.net/petermsh/article/details/78458585
1. 调用包函数绘制圆形Circle和椭圆Ellipse
from matplotlib.patches import Ellipse, Circle
import matplotlib.pyplot as plt

fig = plt.figure()
ax = fig.add_subplot(111)

ell1 = Ellipse(xy = (0.0, 0.0), width = 4, height = 8, angle = 30.0, facecolor= 'yellow', alpha=0.3)
cir1 = Circle(xy = (0.0, 0.0), radius=2, alpha=0.5)
ax.add_patch(ell1)
ax.add_patch(cir1)

x, y = 0, 0
ax.plot(x, y, 'ro')

plt.axis('scaled')

plt.axis('equal')   #changes limits of x or y axis so that equal increments of x and y have the same length

plt.show()

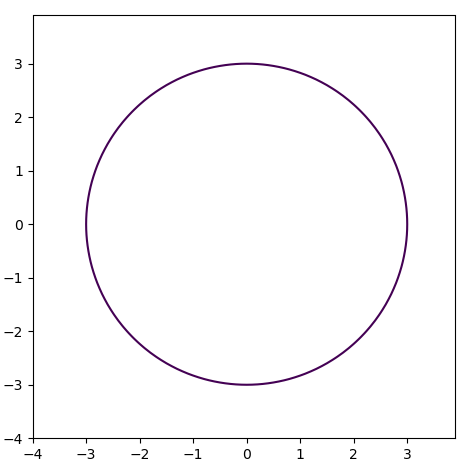
import numpy as np
import matplotlib.pyplot as plt

x = y = np.arange(-4, 4, 0.1)
x, y = np.meshgrid(x,y)
plt.contour(x, y, x**2 + y**2, [9])     #x**2 + y**2 = 9 的圆形

plt.axis('scaled')
plt.show()
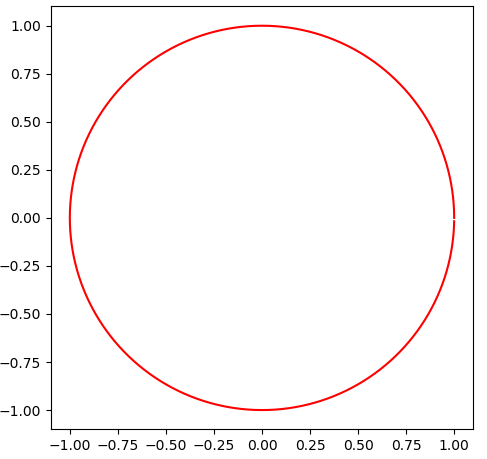
2.用圆的参数方程画圆
from math import pi
from numpy import cos, sin
from matplotlib import pyplot as plt

if __name__ == '__main__':
    '''plot data margin'''
    angles_circle = [i * pi / 180 for i in range(0, 360)]  # i先转换成double

    x = cos(angles_circle)
    y = sin(angles_circle)
    plt.plot(x, y, 'r')

    plt.axis('equal')
    plt.axis('scaled')
    plt.show()
以下源自:https://blog.csdn.net/qq_35882901/article/details/79492640
3.参数方程的另一种写法:
import numpy as np
from matplotlib import pyplot as plt
r=2.0
a,b=0.0,0.0
#方法一:参数方程
theta = np.arange(0, 2*np.pi, 0.01)
x = a + r * np.cos(theta)
y = b + r * np.sin(theta)


fig = plt.figure()
axes = fig.add_subplot(111)
axes.plot(x, y)

axes.axis('equal')

plt.show()

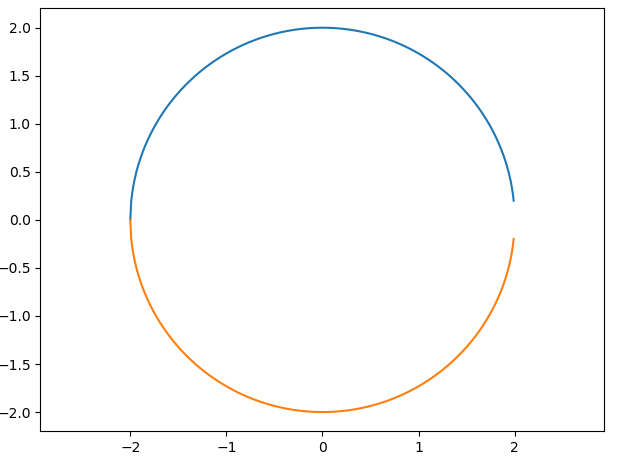
4.标准方程:
import numpy as np
from matplotlib import pyplot as plt
r=2.0
a,b=0.0,0.0
# 方法二:标准方程
x = np.arange(a-r, a+r, 0.01)
y = b + np.sqrt(r**2 - (x - a)**2)

fig = plt.figure()
axes = fig.add_subplot(111)
axes.plot(x, y) # 上半部
axes.plot(x, -y) # 下半部

axes.axis('equal')

plt.show()