[mysql@mysqlhq scripts]$ cat /etc/redhat-release
Kylin Linux release 3.3.1707 (Core)
mysql version
Server version: 5.6.15-log MySQL Community Server - (GPL)
1 初始情况
[root@mysqlhq scripts]# free -m
total used free shared buff/cache available
Mem: 15887 7373 215 117 8298 8033
Swap: 8063 8 8055
[root@mysqlhq scripts]# top
top - 10:09:44 up 85 days, 2 min, 3 users, load average: 0.00, 0.01, 0.05
Tasks: 157 total, 1 running, 156 sleeping, 0 stopped, 0 zombie
%Cpu(s): 0.3 us, 0.3 sy, 0.0 ni, 99.3 id, 0.0 wa, 0.0 hi, 0.0 si, 0.0 st
KiB Mem : 16268752 total, 220424 free, 7550344 used, 8497984 buff/cache
KiB Swap: 8257532 total, 8248616 free, 8916 used. 8225992 avail Mem

PID USER PR NI VIRT RES SHR S %CPU %MEM TIME+ COMMAND
23103 root 20 0 157724 2296 1568 R 0.3 0.0 0:00.54 top
1 root 20 0 125340 3580 2092 S 0.0 0.0 7:19.82 systemd
2 启动mysql
[mysql@mysqlhq scripts]$ ./mysql_db_startup.sh
startup mysql service:localhost_3306
[mysql@mysqlhq scripts]$ 181225 10:55:19 mysqld_safe Logging to '/home/data/mysqldata/3306/log/mysql-error.log'.
181225 10:55:19 mysqld_safe Starting mysqld daemon with databases from /home/data/mysqldata/3306/data
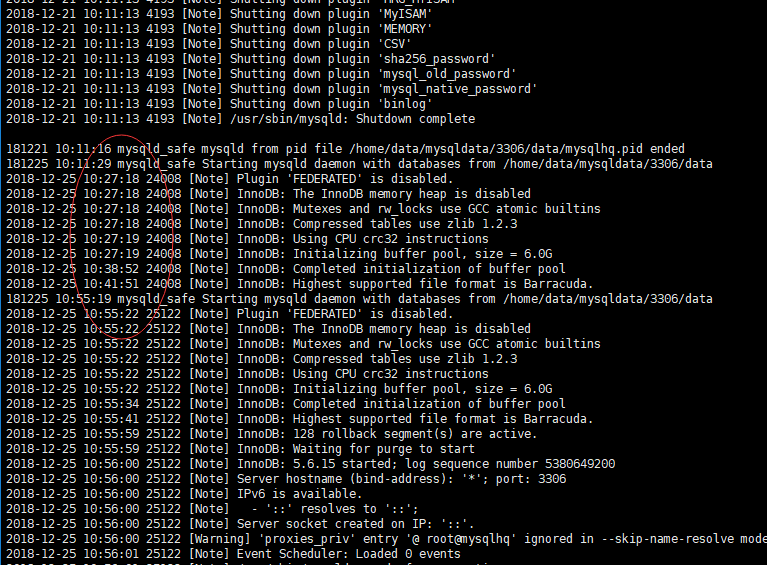
然后一直卡主,查询errorlog,没有什么有用的信息
2018-12-21 10:11:13 4193 [Note] Shutting down plugin 'binlog'
2018-12-21 10:11:13 4193 [Note] /usr/sbin/mysqld: Shutdown complete
181221 10:11:16 mysqld_safe mysqld from pid file /home/data/mysqldata/3306/data/mysqlhq.pid ended
181225 10:11:29 mysqld_safe Starting mysqld daemon with databases from /home/data/mysqldata/3306/data
2018-12-25 10:27:18 24008 [Note] Plugin 'FEDERATED' is disabled.
3 top
24008 mysql 20 0 7810972 1.264g 3764 R 48.7 8.1 21:50.02 mysqld
4 查询其他相关信息
[root@mysqlhq scripts]# vmstat 1
procs -----------memory---------- ---swap-- -----io---- -system-- ------cpu-----
 r  b   swpd   free   buff  cache   si   so    bi    bo   in   cs us sy id wa st
 3  0   8916 178104      0 7632784    0    0     6   104    3    4  0  0 99  0  0
 4  0   8916 177608      0 7632784    0    0     0     0  123   94  0 100  0  0  0
 3  0   8916 177112      0 7632784    0    0     0     0  113   67  0 100  0  0  0
 2  1   8916 176492      0 7632784    0    0     0     0  122   82  0 100  0  0  0
 4  0   8916 175996      0 7632784    0    0     0     0  134   93 10 90  0  0  0
 4  1   8916 175376      0 7632784    0    0     0     0  137   71  8 92  0  0  0
sy 系统CPU时间,如果太高,表示系统调用时间长,例如是IO操作频繁

[root@mysqlhq ~]# pidstat -w -u 1
Linux 3.10.0-514.ky3.kb3.x86_64 (mysqlhq)     12/25/2018     _x86_64_    (1 CPU)

10:26:50 AM   UID       PID    %usr %system  %guest   %wait    %CPU   CPU  Command
10:27:02 AM     0        26    0.00   40.48    0.00   83.33   40.48     0  kswapd0
10:27:02 AM     0       654    0.00    0.79    0.00   19.84    0.79     0  vmtoolsd
10:27:02 AM    42      2276    0.79    0.00    0.00    2.38    0.79     0  gnome-shell
10:27:02 AM  1000     24008    1.59  100.00    0.00  100.00  100.00     0  mysqld
10:27:02 AM     0     24028    0.00    0.79    0.00    3.97    0.79     0  top
10:27:02 AM     0     24072    3.17  100.00    0.00  100.00  100.00     0  pidstat

[root@mysqlhq ~]# pidstat -wt 1
Linux 3.10.0-514.ky3.kb3.x86_64 (mysqlhq)     12/25/2018     _x86_64_    (1 CPU)

10:28:19 AM   UID      TGID       TID   cswch/s nvcswch/s  Command
10:28:44 AM     0         1         -      1.12      0.37  systemd
10:28:44 AM     0         -         1      1.12      0.37  |__systemd
10:28:44 AM     0         2         -      0.37      0.00  kthreadd
10:28:44 AM     0         -         2      0.37      0.00  |__kthreadd
10:28:44 AM     0         3         -    108.55      0.00  ksoftirqd/0
10:28:44 AM     0         -         3    108.92      0.00  |__ksoftirqd/0
10:28:44 AM     0         9         -    268.77      0.00  rcu_sched
10:28:44 AM     0         -         9    268.77      0.00  |__rcu_sched

10:28:44 AM   UID      TGID       TID   cswch/s nvcswch/s  Command

10:28:49 AM  1000     24008         -      0.00     77.97  mysqld
10:28:49 AM  1000         -     24008      0.00     77.97  |__mysqld

10:28:50 AM     0         -     23104     16.67      0.00  |__kworker/0:1
10:28:50 AM  1000     24008         -      0.00    216.67  mysqld
10:28:50 AM  1000         -     24008      0.00    216.67  |__mysqld
10:40:39 AM   UID      TGID       TID   cswch/s nvcswch/s  Command
10:40:40 AM     0         3         -     57.14      0.00  ksoftirqd/0
10:40:40 AM     0         -         3     57.14      0.00  |__ksoftirqd/0
10:40:40 AM     0         9         -     78.57      0.00  rcu_sched
10:40:40 AM     0         -         9     78.57      0.00  |__rcu_sched
10:40:40 AM     0        26         -      0.00    192.86  kswapd0
10:40:40 AM     0         -        26      0.00    192.86  |__kswapd0
10:40:40 AM     0       401         -    114.29      0.00  xfsaild/dm-0
10:40:40 AM     0         -       401    114.29      0.00  |__xfsaild/dm-0
10:40:40 AM     0       654         -     78.57      0.00  vmtoolsd
10:40:40 AM     0         -       654     78.57      0.00  |__vmtoolsd
10:40:40 AM    26      6735         -     57.14      0.00  postgres
10:40:40 AM    26         -      6735     57.14      0.00  |__postgres
10:40:40 AM     0     23104         -     35.71      0.00  kworker/0:1
10:40:40 AM     0         -     23104     35.71      0.00  |__kworker/0:1
10:40:40 AM  1000     24008         -      0.00     92.86  mysqld
10:40:40 AM  1000         -     24008      0.00     92.86  |__mysqld
10:40:40 AM     0     24029         -      7.14      0.00  sshd


Every 2.0s: cat /proc/interrupts                                                                                                                                                            Tue Dec 25 10:31:54 2018

           CPU0
  0:         24   IO-APIC-edge      timer
  1:         10   IO-APIC-edge      i8042
  6:          2   IO-APIC-edge      floppy
  8:          1   IO-APIC-edge      rtc0
  9:          0   IO-APIC-fasteoi   acpi
 12:         16   IO-APIC-edge      i8042
 14:          0   IO-APIC-edge      ata_piix
 15:    7165685   IO-APIC-edge      ata_piix
 16:         10   IO-APIC-fasteoi   vmwgfx
 17:  107832584   IO-APIC-fasteoi   ioc0
 24:          0   PCI-MSI-edge      PCIe PME, pciehp
 25:          0   PCI-MSI-edge      PCIe PME, pciehp
 26:          0   PCI-MSI-edge      PCIe PME, pciehp
 27:          0   PCI-MSI-edge      PCIe PME, pciehp
 28:          0   PCI-MSI-edge      PCIe PME, pciehp
 29:          0   PCI-MSI-edge      PCIe PME, pciehp
 30:          0   PCI-MSI-edge      PCIe PME, pciehp
 31:          0   PCI-MSI-edge      PCIe PME, pciehp
 32:          0   PCI-MSI-edge      PCIe PME, pciehp
 33:          0   PCI-MSI-edge      PCIe PME, pciehp
 34:          0   PCI-MSI-edge      PCIe PME, pciehp
 35:          0   PCI-MSI-edge      PCIe PME, pciehp
 36:          0   PCI-MSI-edge      PCIe PME, pciehp
 37:          0   PCI-MSI-edge      PCIe PME, pciehp
 38:          0   PCI-MSI-edge      PCIe PME, pciehp
 39:          0   PCI-MSI-edge      PCIe PME, pciehp
 40:          0   PCI-MSI-edge      PCIe PME, pciehp
 41:          0   PCI-MSI-edge      PCIe PME, pciehp
 42:          0   PCI-MSI-edge      PCIe PME, pciehp
 43:          0   PCI-MSI-edge      PCIe PME, pciehp
 44:          0   PCI-MSI-edge      PCIe PME, pciehp
 45:          0   PCI-MSI-edge      PCIe PME, pciehp
 46:          0   PCI-MSI-edge      PCIe PME, pciehp
 47:          0   PCI-MSI-edge      PCIe PME, pciehp
 48:          0   PCI-MSI-edge      PCIe PME, pciehp
 49:          0   PCI-MSI-edge      PCIe PME, pciehp
 50:          0   PCI-MSI-edge      PCIe PME, pciehp
 51:          0   PCI-MSI-edge      PCIe PME, pciehp
 52:          0   PCI-MSI-edge      PCIe PME, pciehp
 53:          0   PCI-MSI-edge      PCIe PME, pciehp
 54:          0   PCI-MSI-edge      PCIe PME, pciehp
 55:          0   PCI-MSI-edge      PCIe PME, pciehp
 56:  273909732   PCI-MSI-edge      ens160-rxtx-0
 57:          0   PCI-MSI-edge      ens160-event-1

[root@mysqlhq ~]# cat /proc/stat |grep ^cpu
cpu  3582623 1829 3424656 721469270 1429046 0 193839 0 0 0
cpu0 3582623 1829 3424656 721469270 1429046 0 193839 0 0 0

[root@mysqlhq scripts]#  perf top

clear_page  /proc/kcore
Percent│
       │
       │
       │    Disassembly of section load0:
       │
       │    ffffffff813250e0 <load0>:
       │      xor    %eax,%eax
       │      mov    $0x40,%ecx
       │      nop
       │10:   dec    %ecx
100.00 │      mov    %rax,(%rdi)
       │      mov    %rax,0x8(%rdi)
       │      mov    %rax,0x10(%rdi)
       │      mov    %rax,0x18(%rdi)
       │      mov    %rax,0x20(%rdi)
       │      mov    %rax,0x28(%rdi)
       │      mov    %rax,0x30(%rdi)
       │      mov    %rax,0x38(%rdi)
       │      lea    0x40(%rdi),%rdi
       │    ↑ jne    10
       │      nop
       │    ← retq
Reading /proc/2243/task/2243/maps time out. You may want to increase the time limit by --proc-map-timeout

Samples: 14K of event 'cpu-clock', Event count (approx.): 58122788
Overhead  Shared Object                         Symbol
  69.91%  [kernel]                              [k] clear_page
   3.71%  [kernel]                              [k] copy_page
   1.17%  [kernel]                              [k] kallsyms_expand_symbol.constprop.1
   1.08%  [kernel]                              [k] module_get_kallsym
   0.83%  perf                                  [.] __symbols__insert
   0.77%  [kernel]                              [k] __do_softirq
   0.77%  ld-2.17.so                            [.] _dl_relocate_object
   0.76%  [kernel]                              [k] strlcpy
   0.66%  [kernel]                              [k] _raw_spin_unlock_irqrestore
   0.58%  [kernel]                              [k] finish_task_switch
   0.55%  libelf-0.166.so                       [.] gelf_getsym
   0.52%  libc-2.17.so                          [.] _IO_vfscanf
   0.44%  [kernel]                              [k] __do_page_fault
[root@mysqlhq ~]# top
top - 10:37:02 up 85 days, 29 min,  4 users,  load average: 2.25, 1.78, 1.38
Tasks: 158 total,   5 running, 153 sleeping,   0 stopped,   0 zombie
%Cpu(s): 10.0 us, 90.0 sy,  0.0 ni,  0.0 id,  0.0 wa,  0.0 hi,  0.0 si,  0.0 st
KiB Mem : 16268752 total,   171688 free,  8890204 used,  7206860 buff/cache
KiB Swap:  8257532 total,  8248616 free,     8916 used.  6885876 avail Mem

  PID USER      PR  NI    VIRT    RES    SHR S %CPU %MEM     TIME+ COMMAND
24181 root      20   0  213132  20072   3752 R 49.0  0.1   0:26.26 perf
24008 mysql     20   0 7810972 1.264g   3764 R 48.7  8.1  21:50.02 mysqld
  401 root      20   0       0      0      0 S  1.7  0.0  27:49.84 xfsaild/dm-0
 2276 gdm       20   0 1374896  66280   8652 S  0.7  0.4  31:39.73 gnome-shell
  654 root      20   0  323576  25444   3304 S  0.3  0.2  80:59.69 vmtoolsd
这时候找不到原因,只好kill -9 mysql
然后又启动mysql,发现秒启
情况不能复现。
在上面情况下, 忘记使用iostat和ifstat查看磁盘和网络的情况。。-----