这段代码实现了在Google earth engine中绘制图像/波段间的散点图,得到相关关系。适用于探究数据间的相关性,进行数据的交叉验证。
代码来源于官方帮助:https://developers.google.com/earth-engine/guides/charts_array_values
// Define an arbitrary region of interest.
var sanFrancisco = ee.Geometry.Rectangle([-122.45, 37.74, -122.4, 37.8]);
// Load a Landsat 8 image.
var image = ee.Image('LANDSAT/LC08/C01/T1_TOA/LC08_044034_20140318');
// Get a dictionary with band names as keys, pixel lists as values.
var result = image.reduceRegion(ee.Reducer.toList(), sanFrancisco, 120);
// Convert the band data to plot on the y-axis to arrays.
var y1 = ee.Array(result.get('B5'));
var y2 = ee.Array(result.get('B6'));
// Concatenate the y-axis data by stacking the arrays on the 1-axis.
var yValues = ee.Array.cat([y1, y2], 1);
// The band data to plot on the x-axis is a List.
var xValues = result.get('B4');
// Make a band correlation chart.
var chart = ui.Chart.array.values(yValues, 0, xValues)
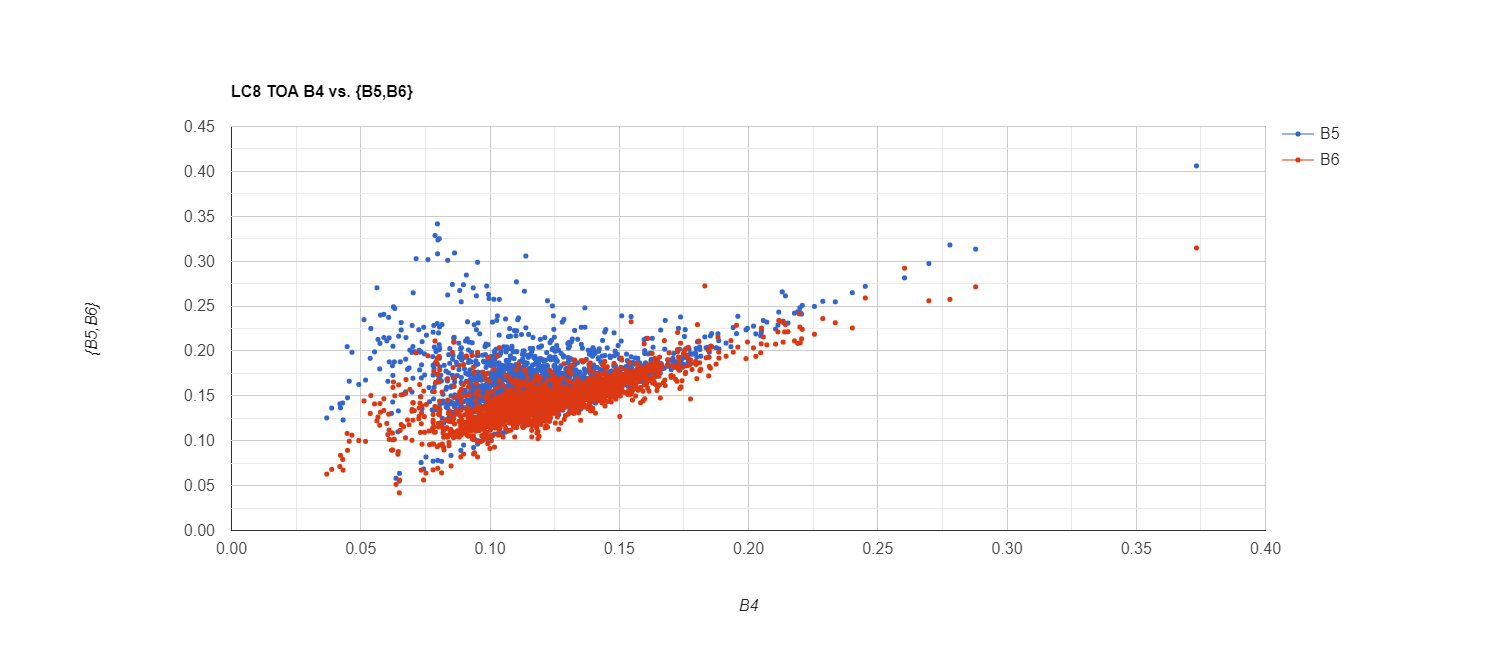
.setSeriesNames(['B5', 'B6'])
.setOptions({
title: 'LC8 TOA B4 vs. {B5,B6}',
hAxis: {'title': 'B4'},
vAxis: {'title': '{B5,B6}'},
pointSize: 3,
});
// Print the chart.
print(chart);