上一篇写了如何使用 Hystrix的dashboard去监控单个应用的访问情况
现在要介绍的是如何去监控整个集群的访问情况,这里要使用到Turbine,一个Netflix的开源项目
它可以将多hystrix.stream的内容聚合为一个数据源供给dashboard展示。
我们先说一下整体的架构:
2个服务调用者:consumer consumer2
分别调用 provider provider2的hello方法
新建一个负责监控的子项目 dashboard-turbine 去监控集群
监控者dashboard-turbine
在 pom.xml 添加依赖
<dependencies>
<dependency>
    <groupId>org.springframework.cloud</groupId>
    <artifactId>spring-cloud-starter-openfeign</artifactId>
    <version>2.1.3.RELEASE</version>
</dependency>

<dependency>
    <groupId>org.springframework.cloud</groupId>
    <artifactId>spring-cloud-starter-netflix-hystrix</artifactId>
</dependency>

<dependency>
    <groupId>org.springframework.cloud</groupId>
    <artifactId>spring-cloud-starter-netflix-hystrix-dashboard</artifactId>
</dependency>

<dependency>
    <groupId>org.springframework.cloud</groupId>
    <artifactId>spring-cloud-starter-netflix-turbine</artifactId>
</dependency>
<dependency>
    <groupId>org.springframework.boot</groupId>
    <artifactId>spring-boot-starter-actuator</artifactId>
</dependency>
</dependencies>
application.yml
spring:
  application:
    name: dashboard

server:
  port: 8060

eureka:
  client:
    service-url:
      defaultZone: http://peer2:8001/eureka/,http://peer3:8002/eureka/
feign:
  hystrix:
    enabled: true

turbine:
  app-config: consumer,consumer2     //注册中心的调用者名称
  aggregator:
    cluster-config: default      //默认default
  cluster-name-expression: new String("default")
turbine.appConfig:配置Eureka中的serviceId列表,表明监控哪些服务turbine.aggregator.clusterConfig:指定聚合哪些集群,多个使用”,”分割,默认为default。可使用http://.../turbine.stream?cluster={clusterConfig之一}访问turbine.clusterNameExpression:- 1. clusterNameExpression指定集群名称,默认表达式appName,此时:
turbine.aggregator.clusterConfig需要配置想要监控的应用名称; - 2. 当clusterNameExpression: default时,
turbine.aggregator.clusterConfig可以不写,因为默认就是default; - 3. 当clusterNameExpression: metadata[‘cluster’]时,假设想要监控的应用配置了
eureka.instance.metadata-map.cluster: ABC,则需要配置,同时turbine.aggregator.clusterConfig: ABC
启动类:
@SpringBootApplication
@EnableHystrixDashboard    //开启监控
@EnableTurbine        //开启turbine支持
public class ApplicationStart {
    public static void main(String[] args) {
        SpringApplication.run(ApplicationStart.class);
    }
}
服务提供provider
和前面几篇的一样,就是多了一个复制品, 并把application.name改为providr2
服务调用consumer
在前面的Hystrix版的调用者的基础上,修改如下:
1.添加pom.xml的依赖
        <dependency>
            <groupId>org.springframework.cloud</groupId>
            <artifactId>spring-cloud-starter-netflix-turbine</artifactId>
        </dependency>
2.启动类添加servlet,所有需要被监控的应用都一定要添加
  @Bean
    public ServletRegistrationBean getServlet(){
        HystrixMetricsStreamServlet streamServlet = new HystrixMetricsStreamServlet();
        ServletRegistrationBean registrationBean = new ServletRegistrationBean(streamServlet);
        registrationBean.setLoadOnStartup(1);
        registrationBean.addUrlMappings("/actuator/hystrix.stream");
        registrationBean.setName("HystrixMetricsStreamServlet");
        return registrationBean;
    }
依次启动2个privider和2个consumer,以及监控dashboard-turbine
打开http://localhost:8060/hystrix/

访问默认集群,输入 : http://localhost:8060/turbine.stream 点击确定,可以看到监控内容,如果一直显示Loading 是因为在等待访问,请求一次服务就有了
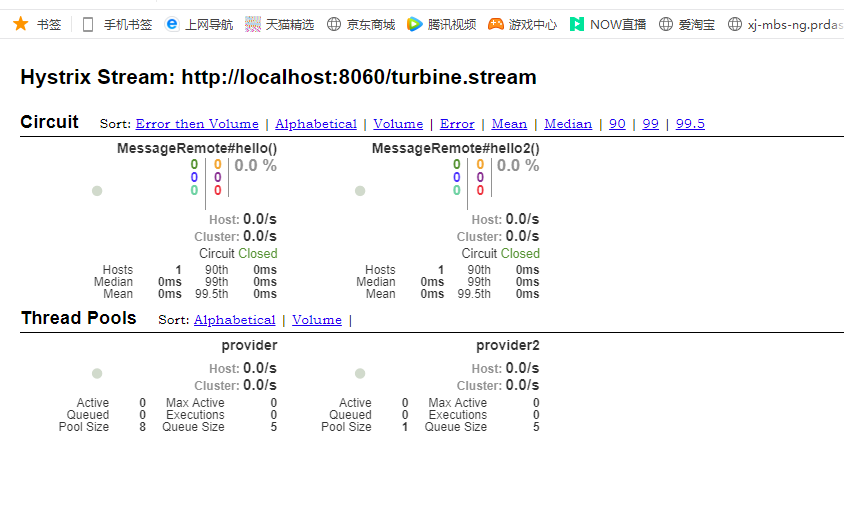
可以看到2个provider的信息和2个consumer的访问情况,分别访问
localhost:8080/message/remote/hello 这是consumer的,监控中对应会有访问显示
localhost:8081/message/remote/hello 这是consumer1的,监控中对应会有访问显示
访问http://localhost:8001/turbine.stream,可以拿到访问情况的数据流,会不断的Ping,往下刷数据
