echarts常见的几种图表配置如下

pie

配置项如下

computed: {
    options() {
      return {
        color: ['#3388FF', '#41C6FB', '#00B587'],
        tooltip: {
          trigger: 'item'
        },
        legend: {
          show: false
        },
        series: [
          {
            name: '',
            type: 'pie',
            radius: '100%',
            animation: false,
            hoverAnimation: false,
            // legendHoverLink: false,
            data: [
              { name: '废水企业', value: 300 },
              { name: '废气企业', value: 300 },
              { name: '污水厂', value: 300 }
            ],
            labelLine: { show: false },
            label: { show: false },
            emphasis: {
              itemStyle: {
                // shadowBlur: 10,
                // shadowOffsetX: 0,
                // shadowColor: 'rgba(0, 0, 0, 0.5)'
              }
            }
          }
        ]
      }
    }
  }

 Bar
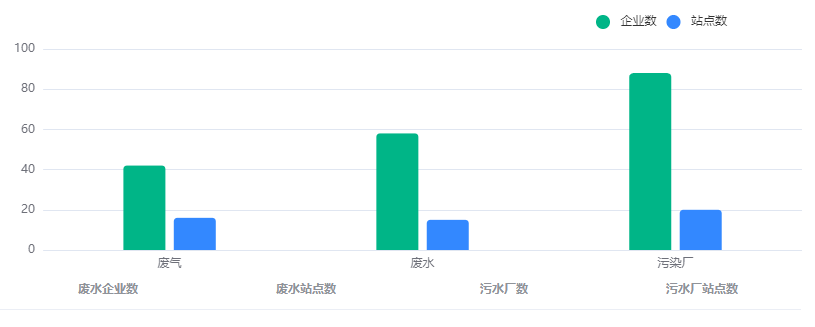
computed: {
    options() {
        return {
            color: ['#3388FF','#41C6FB'],
            tooltip: {
                trigger: 'axis',
                axisPointer: {
                    type: 'cross',
                    crossStyle: {
                        color: '#999999'
                    }
                },
                formatter: function(params) {
                    let axisValue = ''
                    const values = []
                    for (const p in params) {
                        const item = params[p]
                        axisValue = item.axisValue
                        if (item.seriesName == '达标率') {
                            values.push(`${item.seriesName}:(${item.value})%`)
                            continue
                        }
                        values.push(`${item.seriesName}:${item.value}家`)
                    }
                    return `<b>${axisValue}</b><br>${values.join('<br>')}`
                }
            },
            grid: {
                left: '0%',
                right: '0%',
                top: '12%',
                bottom: '3%',
                containLabel: true
            },
            legend: {
                show: false,
                data: [{
                        name: '企业数',
                        icon: 'circle'
                    },
                    {
                        name: '站点数',
                        icon: 'circle'
                    },
                    {
                        name: '达标率',
                        icon: ''
                    }
                ]
            },
            xAxis: [{
                type: 'category',
                data: ['火电', '锅炉', '电解铝', '钢铁', '石油化工', '水泥', '垃圾焚烧', '焦化', '平板玻璃', '其他'],
                axisPointer: {
                    type: 'shadow'
                },
                axisLine: {
                    show: false
                },
                axisTick: {
                    show: false
                }
            }],
            yAxis: [{
                type: 'value',
                name: '',
                // min: 0,
                // max: 250,
                // interval: 50,
                axisLabel: {
                    fontSize: 13,
                    color: '#606266'
                    // interval: 0,
                    // margin: 40,
                    // textStyle: {
                    //   align: 'left',
                    //   baseline: 'middle'
                    // }
                    // formatter: '{value} ml'
                },
                splitLine: {
                    show: true
                }
            }],
            series: [{
                name: '站点数',
                type: 'bar',
                barWidth: 42,
                itemStyle: {
                    borderRadius: [4, 4, 0, 0]
                },
                data: [71, 98, 44, 12, 84, 24, 55, 97, 33, 96]
            }]
        }
    }
},

待后续...

如果这篇文章对您有帮助,您可以打赏我

技术交流QQ群:15129679

原文地址:https://www.cnblogs.com/yeminglong/p/14549766.html