ab命令(ApacheBench)
ApacheBench(即ab)通常用来做网站性能压力测试,是性能调优过程中必不可少的一环,ab命令会创建很多的并发访问线程,模拟多个访问者同时对某一URL地址进行访问。它的测试目标是基于URL的,因此,既可以用来测试Apache的负载压力,也可以测试nginx、lighthttp、tomcat、IIS等其它Web服务器的压力。
ab命令对发出负载的计算机要求很低,既不会占用很高CPU,也不会占用很多内存,但却会给目标服务器造成巨大的负载,其原理类似CC攻击。自己测试使用也须注意,否则一次上太多的负载,可能造成目标服务器因资源耗完,严重时甚至导致死机。
ApacheBench参数说明
格式:ab [options] [http://]hostname[:port]/path
参数说明:
-n requests Number of requests to perform
//在测试会话中所执行的请求个数(本次测试总共要访问页面的次数)。默认时,仅执行一个请求。-c concurrency Number of multiple requests to make
//一次产生的请求个数(并发数)。默认是一次一个。-t timelimit Seconds to max. wait for responses
//测试所进行的最大秒数。其内部隐含值是-n 50000。它可以使对服务器的测试限制在一个固定的总时间以内。默认时,没有时间限制。-p postfile File containing data to POST
//包含了需要POST的数据的文件,文件格式如“p1=1&p2=2”.使用方法是 -p 111.txt 。 (配合-T)-T content-type Content-type header for POSTing
//POST数据所使用的Content-type头信息,如 -T “application/x-www-form-urlencoded” 。 (配合-p)-v verbosity How much troubleshooting info to print
//设置显示信息的详细程度 – 4或更大值会显示头信息, 3或更大值可以显示响应代码(404, 200等), 2或更大值可以显示警告和其他信息。 -V 显示版本号并退出。-w Print out results in HTML tables
//以HTML表的格式输出结果。默认时,它是白色背景的两列宽度的一张表。-i Use HEAD instead of GET
// 执行HEAD请求,而不是GET。-x attributes String to insert as table attributes //用来设置输出结果的表格的table属性
-y attributes String to insert as tr attributes //用来设置输出结果的表格的tr属性
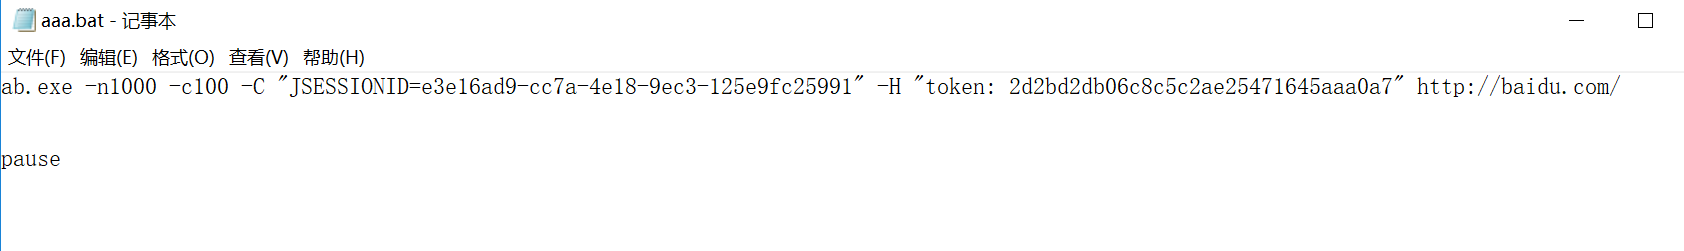
-z attributes String to insert as td or th attributes //用来设置输出结果的表格的th属性-C attribute Add cookie, eg. -C “c1=1234,c2=2,c3=3″ (repeatable)
//-C cookie-name=value 对请求附加一个Cookie:行。 其典型形式是name=value的一个参数对。此参数可以重复,用逗号分割。
提示:可以借助session实现原理传递 JSESSIONID参数, 实现保持会话的功能,如
-C ” c1=1234,c2=2,c3=3, JSESSIONID=FF056CD16DA9D71CB131C1D56F0319F8″ 。-H attribute Add Arbitrary header line, eg. ‘Accept-Encoding: gzip’ Inserted after all normal header lines. (repeatable)
-A attribute Add Basic WWW Authentication, the attributes
are a colon separated username and password.-P attribute Add Basic Proxy Authentication, the attributes
are a colon separated username and password.//-P proxy-auth-username:password 对一个中转代理提供BASIC认证信任。用户名和密码由一个:隔开,并以base64编码形式发送。无论服务器是否需要(即, 是否发送了401认证需求代码),此字符串都会被发送。
-X proxy:port Proxyserver and port number to use
-V Print version number and exit //打印版本号,然后退出
-k Use HTTP KeepAlive feature //使用http keepAlive 特性
-d Do not show percentiles served table.
-S Do not show confidence estimators and warnings.
-g filename Output collected data to gnuplot format file.
-e filename Output CSV file with percentages served
-h Display usage information (this message)
//-attributes 设置属性的字符串. 缺陷程序中有各种静态声明的固定长度的缓冲区。另外,对命令行参数、服务器的响应头和其他外部输入的解析也很简单,这可能会有不良后果。它没有完整地实现 HTTP/1.x; 仅接受某些’预想’的响应格式。 strstr(3)的频繁使用可能会带来性能问题,即你可能是在测试ab而不是服务器的性能。
参数很多,一般我们用 -c 和 -n 参数就可以了。例如:
# ab -c 5000 -n 10000 http://127.0.0.1/index.php
这里用-c指定每次请求并发数为5000,用-n设置请求次数为10000.
如果提示:ab: Cannot use concurrency level greater than total number of requests,说明-c的每次并发数设置太高,ab命令本身没限制,是你的系统有限制。
测试报告
This is ApacheBench, Version 2.0.40-dev <$Revision: 1.146 $> apache-2.0
Copyright 1996 Adam Twiss, Zeus Technology Ltd, http://www.zeustech.net/
Copyright 1997-2005 The Apache Software Foundation, http://www.apache.org/
Benchmarking www.google.com (be patient)…..done
//平台apache 版本2.0.54
Server Software: GWS/2.1//服务器主机名
Server Hostname: www.google.com//服务器端口
Server Port: 80//测试的页面文档
Document Path: ///文档大小
Document Length: 230 bytes//并发数
Concurrency Level: 10/*整个测试持续的时间*/
Time taken for tests: 3.234651 seconds/*完成的请求数量*/
Complete requests: 10/*失败的请求数量*/
Failed requests: 0/*请求写入失败的次数 */
Write errors: 0Non-2xx responses: 10
/*保持联机连接的请求数量。只有在命令行中使用-k,才能看到该属性值。*/
Keep-Alive requests: 10/*整个场景中的网络传输量*/
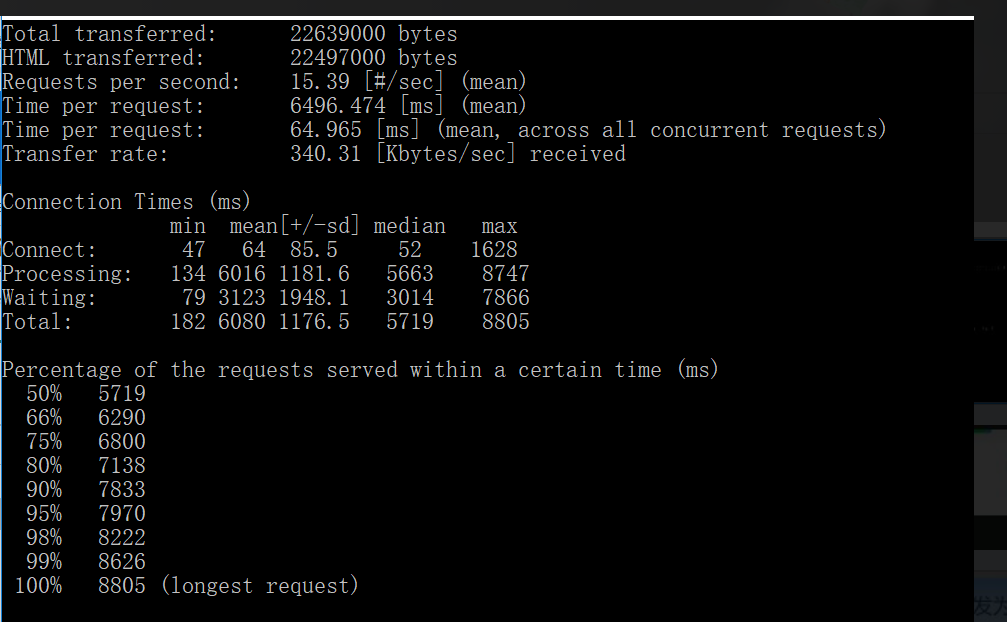
Total transferred: 6020 bytes/*整个场景中的HTML内容传输量*/
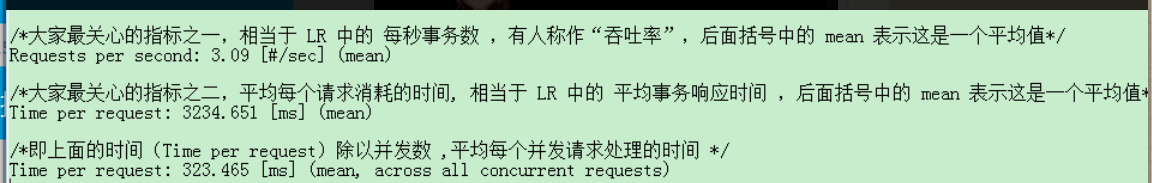
HTML transferred: 2300 bytes/*大家最关心的指标之一,相当于 LR 中的 每秒事务数 ,有人称作“吞吐率”,后面括号中的 mean 表示这是一个平均值*/
Requests per second: 3.09 [#/sec] (mean)/*大家最关心的指标之二,平均每个请求消耗的时间, 相当于 LR 中的 平均事务响应时间 ,后面括号中的 mean 表示这是一个平均值*/
Time per request: 3234.651 [ms] (mean)/*即上面的时间(Time per request)除以并发数 ,平均每个并发请求处理的时间 */
Time per request: 323.465 [ms] (mean, across all concurrent requests)/*平均每秒网络上的流量,可以帮助排除是否存在网络流量过大导致响应时间延长的问题,也就是这些请求在单位时间从服务器获取的数据长度*/
Transfer rate: 1.55 [Kbytes/sec] received/*网络上消耗的时间的分解,各项数据的具体算法还不是很清楚*/
Connection Times (ms)min mean[+/-sd] median max
Connect: 20 318 926.1 30 2954
Processing: 40 2160 1462.0 3034 3154
Waiting: 40 2160 1462.0 3034 3154
Total: 60 2479 1276.4 3064 3184
/*下面的内容为整个场景中所有请求的响应情况。在场景中每个请求都有一个响应时间,其中 50% 的用户响应时间小于 3064 毫秒,60 % 的用户响应时间小于 3094 毫秒,最大的响应时间小于 3184 毫秒*/
Percentage of the requests served within a certain time (ms)50% 3064
66% 3094
75% 3124
80% 3154
90% 3184
95% 3184
98% 3184
99% 3184
100% 3184 (longest request)
--------------------转载
1、准备好ab小工具(我这个不用安装)
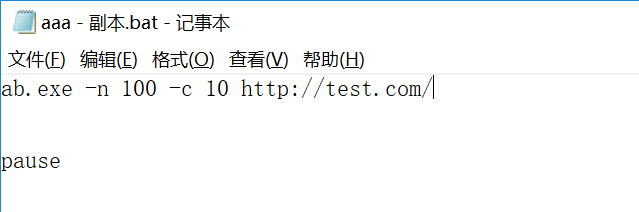
2、编辑aaa.bat这个文件
输入命令
ab -n 100 -c 10 http://test.com/
其中-n表示请求数,-c表示并发数
3、运行aaa.bat文
4、如果需要登陆后得页面,举例我遇到的,有token的
5、主要是要会分析结果
a、一般总次数是并发数的10倍(个人习惯),并发可以从1,10,50,100,200......这样
b、通过chrome去点击你的系统,看看那些请求比较耗时,超过500ms的都可以关注下,测测性能
c、一般说来,并发1测试出来的时间,100并发测试出来的时间相差到30倍以上,就说明程序有一定优化空间。