Leaflet介绍
Leaflet 是一个为建设交互性好适用于移动设备地图,而开发的现代的、开源的 JavaScript 库。代码仅有 33 KB,但它具有开发在线地图的大部分功能。支持插件扩展, Leaflet强大的开源库插件涉及到地图应用的各个方面包括地图服务,数据提供,数据格式,地理编码,路线和路线搜索,地图控件和交互等类型的插件共有140多个。

在线API:http://leafletjs.com/reference-1.2.0.html
在线范例:http://leafletjs.com/examples.html
注:leaflet客户端开发demo参考http://malagis.com/learning-leaflet-js-note.html
SuperMap iClient for Leaflet介绍
SuperMap iClient for Leaflet 是一套基于Leaflet的云GIS网络客户端开发平台, 支持访问SuperMap iServer / iExpress / iPortal / iManager / Online的地图、服务和资源,为用户提供了完整专业的GIS能力, 同时提供了优秀的可视化功能。
官网地址:http://iclient.supermap.io/
在线API:http://iclient.supermapol.com/web/apis/leaflet.html
在线范例:http://iclient.supermapol.com/examples/leaflet/examples.html#iServer
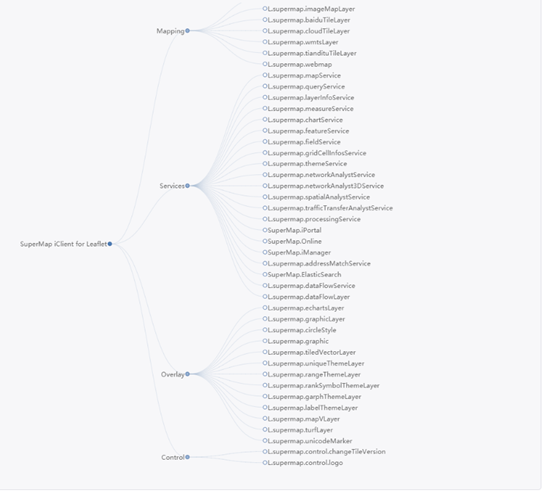
相关模块如下图,分为Mapping,Services, Overlay,Control四个模块
开发入门
1、 引用所需的脚本库和样式文件


1     <link rel="stylesheet" href="https://unpkg.com/leaflet@1.2.0/dist/leaflet.css" integrity="sha512-M2wvCLH6DSRazYeZRIm1JnYyh22purTM+FDB5CsyxtQJYeKq83arPe5wgbNmcFXGqiSH2XR8dT/fJISVA1r/zQ=="
2         crossorigin="" />
3     <script type="text/javascript" src="https://cdn.bootcss.com/leaflet/1.0.3/leaflet.js"></script>
4     <script type="text/javascript" src="http://iclient.supermap.io/dist/iclient9-leaflet.js"></script>
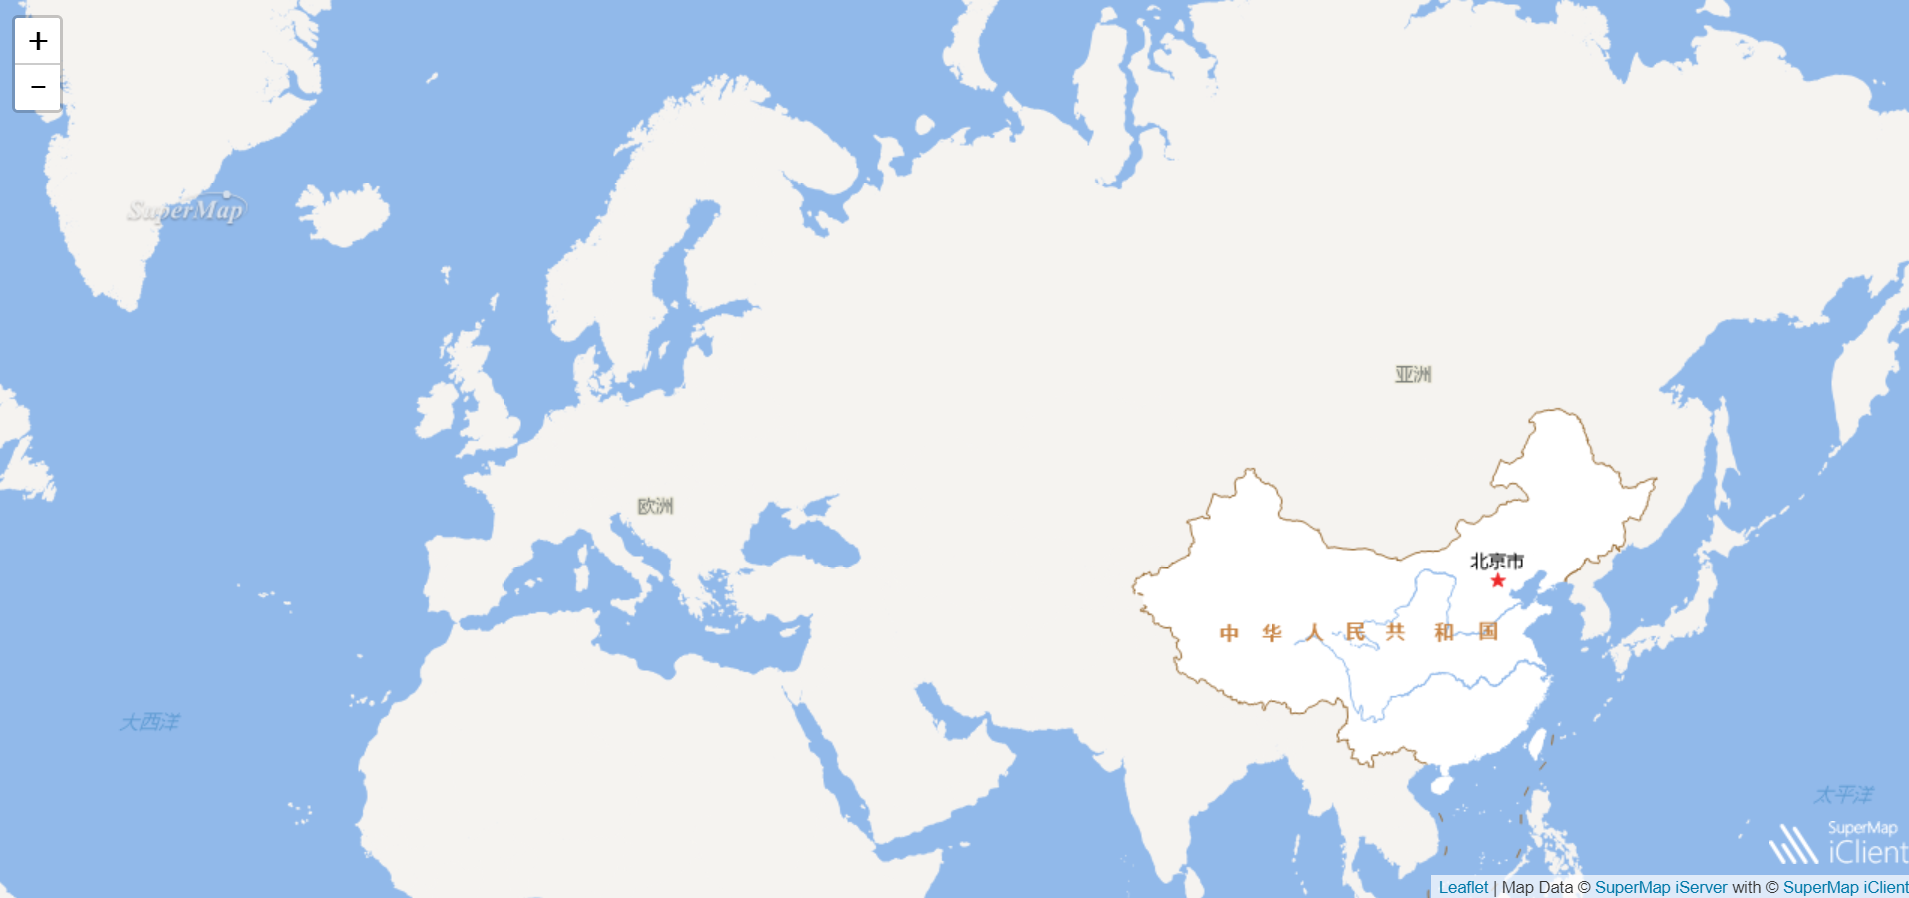
2、加载iServer发布的地图服务,叠加图层代码如下:
 1 <!DOCTYPE html>
 2 <html>
 3
 4 <head>
 5     <meta charset="UTF-8">
 6     <title>加载瓦片</title>
 7 </head>
 8
 9 <body style=" margin: 0;overflow: hidden;background: #fff; 100%;height:100%;position: absolute;top: 0;">
10
11     <div id="map" style="margin:0 auto; 100%;height: 100%"></div>
12
13     <link rel="stylesheet" href="https://unpkg.com/leaflet@1.2.0/dist/leaflet.css" integrity="sha512-M2wvCLH6DSRazYeZRIm1JnYyh22purTM+FDB5CsyxtQJYeKq83arPe5wgbNmcFXGqiSH2XR8dT/fJISVA1r/zQ=="
14         crossorigin="" />
15     <script type="text/javascript" src="https://cdn.bootcss.com/leaflet/1.0.3/leaflet.js"></script>
16     <script type="text/javascript" src="http://iclient.supermap.io/dist/iclient9-leaflet.js"></script>
17     <script type="text/javascript">
18         var host = window.isLocal ? document.location.protocol + "//" + document.location.host : "http://support.supermap.com.cn:8090";
19         var map, resultLayer, infoWin, url = "http://localhost:8090/iserver/services/map-ugcv5-China1/rest/maps/China1";
20         //定义出图的比例尺,此处和切图时设定的比例尺保持一致
21         var scaleDenominators = [591658711, 295829355, 147914678, 73957339, 36978669, 18489335, 9244667, 4622334, 2311167, 1155583, 577792, 288896, 144448];
22         //地图原点
23         var origin = [0, 0];
24         //leaflet CRS投影设置
25         var crs = L.Proj.CRS("EPSG:3857", {
26             origin: origin,
27             scaleDenominators: scaleDenominators
28         });
29
30         map = L.map('map', {
31             preferCanvas: true,
32             crs: crs,
33             center: { lon: 0, lat: 0 },
34             maxZoom: 13,
35             zoom: 0
36         });
37         L.supermap.tiledMapLayer(url, {
38             transparent: true,
39             cacheEnabled: true
40         }).addTo(map);
41
42     </script>
43 </body>
44
45 </html>
注:地图投影参数设置,见如下代码:
1 var crs = L.Proj.CRS("EPSG:4326", {
2     origin: [114.59, 42.31],
3     scaleDenominators: [100000, 50000, 25000, 20000, 10000, 5000, 2000, 1000, 500, 200, 100, 50, 20, 1]
4 });
5 map = L.map('map', {
6     crs: crs,
7     center: [39.79, 116.85],
8 });
9 L.supermap.tiledMapLayer(url).addTo(map);
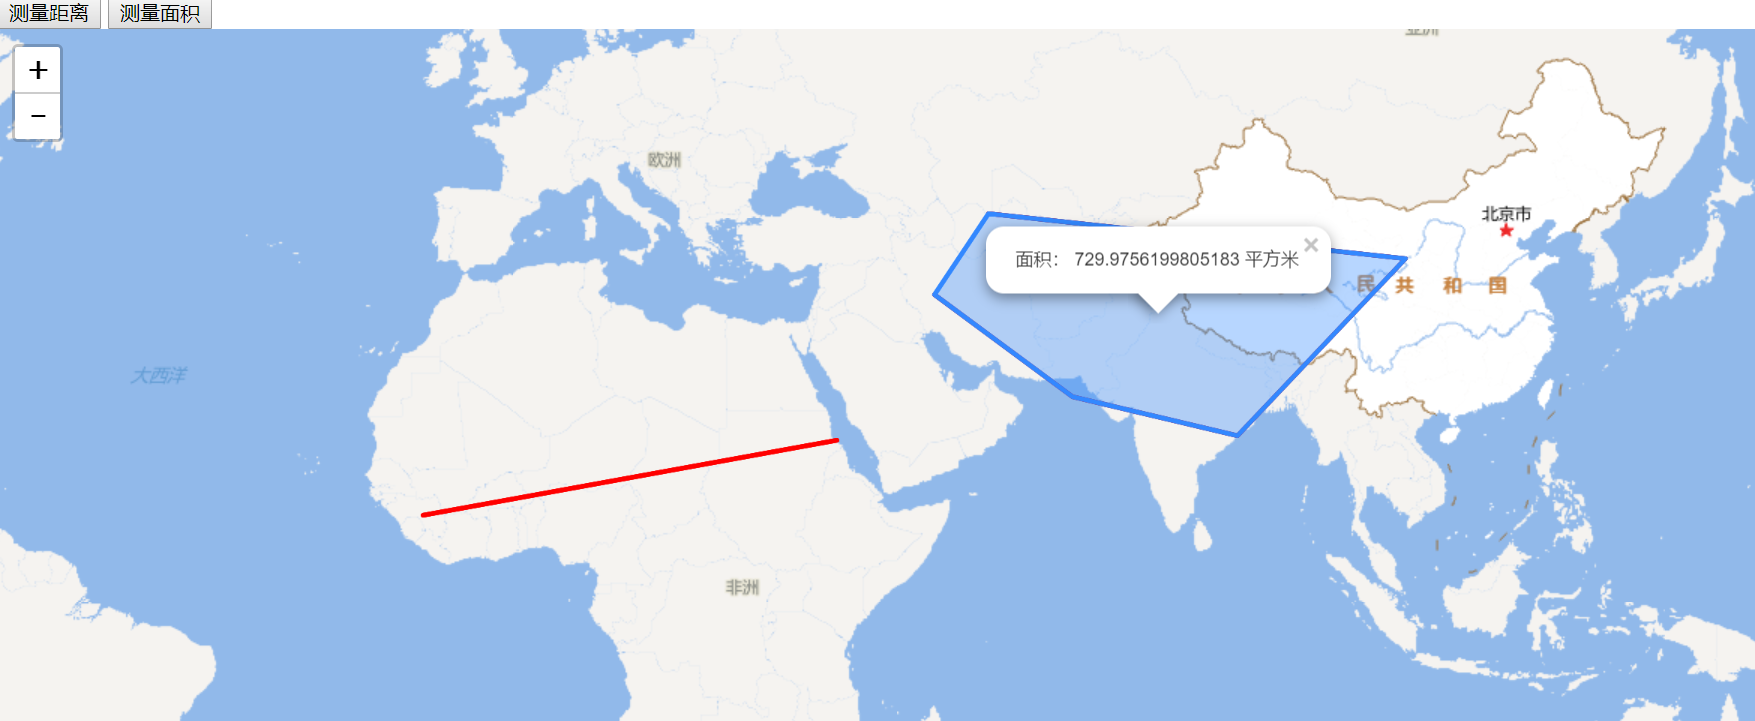
3、测量服务,在地图界面上绘制线、面,计算距离和面积,代码如下:
  1 <!DOCTYPE html>
  2 <html>
  3
  4 <head>
  5     <meta charset="UTF-8">
  6     <title>地图上测量demo</title>
  7 </head>
  8
  9 <body style=" margin: 0;overflow: hidden;background: #fff; 100%;height:100%;position: absolute;top: 0;">
 10     <div id="toolbar">
 11         <input type="button" class="btn" value="测量距离" onclick="measureLength()" />
 12         <input type="button" class="btn" value="测量面积" onclick="measureArea()" />
 13     </div>
 14     <div id="map" style="margin:0 auto; 100%;height: 100%"></div>
 15
 16     <link rel="stylesheet" href="https://unpkg.com/leaflet@1.2.0/dist/leaflet.css" integrity="sha512-M2wvCLH6DSRazYeZRIm1JnYyh22purTM+FDB5CsyxtQJYeKq83arPe5wgbNmcFXGqiSH2XR8dT/fJISVA1r/zQ=="
 17         crossorigin="" />
 18     <script type="text/javascript" src="https://cdn.bootcss.com/leaflet/1.0.3/leaflet.js"></script>
 19     <script type="text/javascript" src="http://iclient.supermap.io/dist/iclient9-leaflet.js"></script>
 20     <script type="text/javascript">
 21         var host = window.isLocal ? document.location.protocol + "//" + document.location.host : "http://support.supermap.com.cn:8090";
 22         var map, resultLayer, infoWin, url = "http://support.supermap.com.cn:8090/iserver/services/map-china400/rest/maps/China";
 23         map = L.map('map', {
 24             preferCanvas: true,
 25             crs: L.CRS.EPSG3857,
 26             center: { lon: 0, lat: 0 },
 27             maxZoom: 13,
 28             zoom: 3
 29         });
 30         L.supermap.tiledMapLayer(url).addTo(map);
 31         resultLayer = L.featureGroup().addTo(map);
 32
 33         //绘制线,测量距离
 34         function measureLength() {
 35             var points = [],
 36                 points_length = 0,
 37                 polyline;
 38             // 单击
 39             var clickFlag,
 40                 clickTimes = 1,
 41                 isDrag = false;
 42             map.on('mousedown', function (e) {
 43                 map.off('mousemove');
 44                 if (clickFlag) clearTimeout(clickFlag);
 45                 clickFlag = setTimeout(function () {
 46                     if (clickTimes == 1 && !isDrag) {
 47                         points.push([e.latlng.lat, e.latlng.lng]);
 48                         points_length = points.length;
 49                         // 移动
 50                         map.on('mousemove', function (e) {
 51                             // 清除
 52                             if (polyline) map.removeLayer(polyline);
 53                             // polyline
 54                             points[points_length] = [e.latlng.lat, e.latlng.lng];
 55                             polyline = new L.Polyline(points, { color: "red" });
 56                             resultLayer.addLayer(polyline);
 57                         });
 58                     }
 59                 }, 300);
 60             });
 61             var popup = new L.popup();
 62             // 双击
 63             map.on('dblclick', function (e) {
 64                 if (points.length) {
 65                     clickTimes = 2;
 66                     // polyline
 67                     polyline = new L.Polyline(points, { color: "red" });
 68                     //map.addLayer(polyline);
 69                     resultLayer.addLayer(polyline)
 70                     // 移除事件
 71                     map.off('mousemove');
 72                 }
 73                 var distanceMeasureParam = new SuperMap.MeasureParameters(polyline);
 74                 L.supermap.measureService(url).measureDistance(distanceMeasureParam, function (serviceResult) {
 75                     //console.log("距离: " + serviceResult.result.distance + "  米");
 76                     popup
 77                         .setLatLng(e.latlng)
 78                         .setContent("距离: " + serviceResult.result.distance + "  米")
 79                         .openOn(map);
 80                 });
 81             });
 82             // 拖动
 83             map.on('movestart', function () {
 84                 isDrag = true;
 85             });
 86             map.on('moveend', function () {
 87                 isDrag = false;
 88             });
 89         }
 90
 91         //绘制面,测量面积
 92         function measureArea() {
 93             var points = [],
 94                 points_length = 0,
 95                 polyline,
 96                 polygon;
 97             // 单击
 98             var clickFlag,
 99                 clickTimes = 1,
100                 isDrag = false;
101             map.on('mousedown', function (e) {
102                 map.off('mousemove');
103                 if (clickFlag) clearTimeout(clickFlag);
104                 clickFlag = setTimeout(function () {
105                     if (clickTimes == 1 && !isDrag) {
106                         points.push([e.latlng.lat, e.latlng.lng]);
107                         points_length = points.length;
108                         // 移动
109                         map.on('mousemove', function (e) {
110                             // 清除
111                             if (polyline) map.removeLayer(polyline);
112                             if (polygon) map.removeLayer(polygon);
113                             // polyline
114                             points[points_length] = [e.latlng.lat, e.latlng.lng];
115                             polyline = new L.Polyline(points);
116                             resultLayer.addLayer(polyline);
117                             // polygon
118                             polygon = new L.Polygon(points);
119                             resultLayer.addLayer(polygon);
120                         });
121                     }
122                 }, 300);
123             });
124             var popup = new L.popup();
125             // 双击
126             map.on('dblclick', function (e) {
127                 if (points.length) {
128                     clickTimes = 2;
129                     // polyline
130                     polyline = new L.Polyline(points, { color: "red" });
131                     //map.addLayer(polyline);
132                     resultLayer.addLayer(polyline)
133                     polygon = new L.Polygon(points);
134                     resultLayer.addLayer(polygon);
135                     // 移除事件
136                     map.off('mousemove');
137                 }
138                 var areaMeasureParam = new SuperMap.MeasureParameters(polygon);
139                 L.supermap
140                     .measureService(url)
141                     .measureArea(areaMeasureParam, function (serviceResult) {
142                         popup
143                         .setLatLng(polygon.getCenter())
144                         .setContent("面积: " + serviceResult.result.area + "  平方米")
145                         .openOn(map);
146                     });
147             });
148             // 拖动
149             map.on('movestart', function () {
150                 isDrag = true;
151             });
152             map.on('moveend', function () {
153                 isDrag = false;
154             });
155         }
156     </script>
157 </body>
158
159 </html>
测量的效果图如下:
4、使用iServer发布的数据服务,进行sql查询,代码如下:
 1 <!DOCTYPE html>
 2 <html>
 3
 4 <head>
 5     <meta charset="UTF-8">
 6     <title>数据集SQL查询</title>
 7 </head>
 8
 9 <body style=" margin: 0;overflow: hidden;background: #fff; 100%;height:100%;position: absolute;top: 0;">
10     <div id="map" style="margin:0 auto; 100%;height: 100%"></div>
11
12     <link rel="stylesheet" href="https://unpkg.com/leaflet@1.2.0/dist/leaflet.css" integrity="sha512-M2wvCLH6DSRazYeZRIm1JnYyh22purTM+FDB5CsyxtQJYeKq83arPe5wgbNmcFXGqiSH2XR8dT/fJISVA1r/zQ=="
13         crossorigin="" />
14     <script type="text/javascript" src="https://cdn.bootcss.com/leaflet/1.0.3/leaflet.js"></script>
15     <script type="text/javascript" src="http://iclient.supermap.io/dist/iclient9-leaflet.js"></script>
16     <script type="text/javascript">
17         var host = window.isLocal ? document.location.protocol + "//" + document.location.host : "http://support.supermap.com.cn:8090";
18         var map, resultLayer,
19             baseUrl = "http://localhost:8090/iserver/services/map-World/rest/maps/World_Google",
20             url = "http://localhost:8090/iserver/services/data-World/rest/data";
21         map = L.map('map', {
22             preferCanvas: true,
23             crs: L.CRS.EPSG4326,
24             center: { lon: 0, lat: 0 },
25             maxZoom: 18,
26             zoom: 1
27         });
28         L.supermap.tiledMapLayer(baseUrl).addTo(map);
29         query();
30
31         function query() {
32             var sqlParam = new SuperMap.GetFeaturesBySQLParameters({
33                 toIndex: -1,
34                 maxFeatures:10000,
35                 queryParameter: {
36                     name: "world@World",
37                     attributeFilter: "SMID>0",
38                 },
39                 datasetNames: ["World:world"]
40             });
41             L.supermap
42                 .featureService(url)
43                 .getFeaturesBySQL(sqlParam, function (serviceResult) {
44                     resultLayer = L.geoJSON(serviceResult.result.features).addTo(map).bindPopup('SMID > 0');
45
46                     console.log(serviceResult.result.featureCount);
47                 });
48         }
49         //点击地图事,弹窗显示坐标值
50         var popup = L.popup();
51
52         function onMapClick(e) {
53             popup
54                 .setLatLng(e.latlng)
55                 .setContent("You clicked the map at " + e.latlng.toString())
56                 .openOn(map);
57         }
58
59         map.on('click', onMapClick);
60     </script>
61 </body>
62
63 </html>
查询的效果图如下:

5、使用iServer地图服务,生成专题图,进行绘制,代码如下:
 1 <!DOCTYPE html>
 2 <html>
 3 <head>
 4     <meta charset="UTF-8">
 5     <title>范围分段专题图</title>
 6 </head>
 7 <body style=" margin: 0;overflow: hidden;background: #fff; 100%;height:100%;position: absolute;top: 0;">
 8 <div id="map" style="margin:0 auto; 100%;height: 100%"></div>
 9 <link rel="stylesheet" href="https://unpkg.com/leaflet@1.2.0/dist/leaflet.css" integrity="sha512-M2wvCLH6DSRazYeZRIm1JnYyh22purTM+FDB5CsyxtQJYeKq83arPe5wgbNmcFXGqiSH2XR8dT/fJISVA1r/zQ=="
10 crossorigin="" />
11 <script type="text/javascript" src="https://cdn.bootcss.com/leaflet/1.0.3/leaflet.js"></script>
12 <script type="text/javascript" src="http://iclient.supermap.io/dist/iclient9-leaflet.js"></script>
13
14
15 <script type="text/javascript">
16     var host = window.isLocal ? window.server : "http://support.supermap.com.cn:8090";
17     var map, themeService, themeRange, themeParameters, themeLayer,
18         url = host + "/iserver/services/map-china400/rest/maps/China";
19     map = L.map('map', {
20         center: [30, 84],
21         maxZoom: 18,
22         zoom: 3
23     });
24     L.supermap.tiledMapLayer(url, {noWrap: true, transparent: true}).addTo(map);
25     createTheme();
26
27     function createTheme() {
28         themeService = L.supermap.themeService(url);
29         var themeRangeItem1 = new SuperMap.ThemeRangeItem({
30             start: 0,
31             end: 500000000000,
32             style: new SuperMap.ServerStyle({
33                 fillForeColor: new SuperMap.ServerColor(211, 255, 250),
34                 lineColor: new SuperMap.ServerColor(179, 209, 193),
35                 lineWidth: 0.1
36             })
37         });
38         var themeRangeItem2 = new SuperMap.ThemeRangeItem({
39             start: 500000000000,
40             end: 1000000000000,
41             style: new SuperMap.ServerStyle({
42                 fillForeColor: new SuperMap.ServerColor(178, 218, 199),
43                 lineColor: new SuperMap.ServerColor(179, 209, 193),
44                 lineWidth: 0.1
45             })
46         });
47         var themeRangeItem3 = new SuperMap.ThemeRangeItem({
48             start: 1000000000000,
49             end: 3000000000000,
50             style: new SuperMap.ServerStyle({
51                 fillForeColor: new SuperMap.ServerColor(58, 178, 166),
52                 lineColor: new SuperMap.ServerColor(179, 209, 193),
53                 lineWidth: 0.1
54             })
55         });
56         themeRange = new SuperMap.ThemeRange({
57             rangeExpression: "SMAREA",
58             rangeMode: SuperMap.RangeMode.EQUALINTERVAL,
59             items: [themeRangeItem1, themeRangeItem2, themeRangeItem3]
60         });
61         themeParameters = new SuperMap.ThemeParameters({
62             datasetNames: ["China_Province_pg"],
63             dataSourceNames: ["China"],
64             joinItems: null,
65             themes: [themeRange]
66         });
67         themeService.getThemeInfo(themeParameters, function (serviceResult) {
68             var result = serviceResult.result;
69             if (result && result.newResourceID) {
70                 themeLayer = L.supermap.tiledMapLayer(url, {
71                     noWrap: true,
72                     cacheEnabled: false,
73                     transparent: true,
74                     layersID: result.newResourceID
75                 }).addTo(map);
76             }
77         });
78     }
79 </script>
80 </body>
81 </html>
专题图的效果如下:

6、点聚合功能,代码如下:
 1 <!DOCTYPE html>
 2 <html>
 3 <head>
 4     <meta charset="UTF-8">
 5     <title>点聚合</title>
 6 </head>
 7 <body style=" margin: 0;overflow: hidden;background: #fff; 100%;height:100%;position: absolute;top: 0;">
 8 <div id="map" style="margin:0 auto; 100%;height: 100%"></div>
 9 <link rel="stylesheet" href="https://unpkg.com/leaflet@1.2.0/dist/leaflet.css" integrity="sha512-M2wvCLH6DSRazYeZRIm1JnYyh22purTM+FDB5CsyxtQJYeKq83arPe5wgbNmcFXGqiSH2XR8dT/fJISVA1r/zQ=="
10 crossorigin="" />
11 <script type="text/javascript" src="https://cdn.bootcss.com/leaflet/1.0.3/leaflet.js"></script>
12 <script type="text/javascript" src="http://iclient.supermap.io/dist/iclient9-leaflet.js"></script>
13 <script type="text/javascript">
14     var host = window.isLocal ? window.server : "http://support.supermap.com.cn:8090";
15     var map, resultLayer, getFeatureBySQLParams,
16         dataUrl = host + "/iserver/services/data-DynamicData/rest/data",
17         url = host + "/iserver/services/map-china400/rest/maps/China";
18     map = L.map('map', {
19         preferCanvas: true,
20         center: [32, 104],
21         maxZoom: 18,
22         zoom: 4
23     });
24     L.supermap.tiledMapLayer(url).addTo(map);
25     resultLayer = L.markerClusterGroup({
26         spiderfyOnMaxZoom: false,
27         showCoverageOnHover: false,
28         zoomToBoundsOnClick: false
29     });
30     getFeatureBySQLParams = new SuperMap.GetFeaturesBySQLParameters({
31         queryParameter: new SuperMap.FilterParameter({
32             name: "Train@DynamicData",
33             attributeFilter: "SmID>100 and SmID < 800"
34         }),
35         toIndex: -1,
36         datasetNames: ["DynamicData:Train"]
37     });
38     loadMarkerCluster();
39
40     function loadMarkerCluster() {
41         L.supermap
42             .featureService(dataUrl)
43             .getFeaturesBySQL(getFeatureBySQLParams, function (serviceResult) {
44                 createLayers(serviceResult.result.features);
45             });
46     }
47
48     function createLayers(result) {
49         if (!result || !result.features || result.features.length < 1) {
50             return;
51         }
52         result.features.map(function (feature) {
53             var latLng = L.CRS.EPSG3857.unproject(L.point(feature.geometry.coordinates));
54             resultLayer.addLayer(L.marker(latLng));
55         });
56         resultLayer.addTo(map);
57     }
58 </script>
59 </body>
60 </html>
聚合效果如下图所示:
7、结合eCharts实例,代码如下:
效果如下图所示:
8、最佳路径分析,代码如下:
效果如下图所示:
9、对绘制到地图上的几何对象进行缓冲区分析,代码如下:
效果如下图所示:
10、