此文档解决以下问题:
1.读取txt文件
1.1 从文本文件中读取数据
1.2 将文本文件中的数据读入数组,并作为列表输出
1.3 从文本文件中的读取数据,以警告框输出
1.4 从文本文件中的读取数据和状态,以警告框输出
2.读取CSV文件
2.1 将文本文件中的数据读入对象并作为表输出
二、使用XML数据
3.读取XML文件
3.1 xml数据导入
4.使用XSLT设计样式
4.1 XML数据导入和转换,并使用XSLT设计样式
三、使用JSON数据
5.读取JSON文件
5.1 直接访问JSON值
5.2 使用JSON.parse()方法访问
5.3 使用$.getJSON()方法访问
5.4 JSON数据在画布绘制图表
数据可视化工作最大的一部分工作涉及的是渲染现有数据。数据可以被存储为许多不同的格式——普通文本,CSV、XML、JSON和其他格式——但只要是数字格式,JavaScript或其他服务器端例程就与可能访问该信息用于展示。当然在某些情况下,例如构建复杂的图表时,会要求你手动处理数据。不过,在可能的情况下,将内容(数据)和显示(图表)分离是一个好主意。
5.读取JSON文件
5.1 直接访问JSON值,json_eval.html中,
<!doctype html>
<html>

    <head>
        <meta charset="UTF-8">
        <title>JSON Object Example</title>
    </head>

    <body>
        <h1>JSON Object example</h1>
        <script>
            var jsonObj = {
                "sales": [{
                        "region": "Northeast",
                        "employees": 150,
                        "amount": "115,000"
                    },
                    {
                        "region": "Southeast",
                        "employees": 125,
                        "amount": "95,000"
                    },
                    {
                        "region": "West",
                        "employees": 325,
                        "amount": "265,000"
                    }
                ]
            };
            var theAmount = jsonObj.sales[1].amount;
            alert(theAmount);
        </script>
        </script>
    </body>

</html>
运行结果:
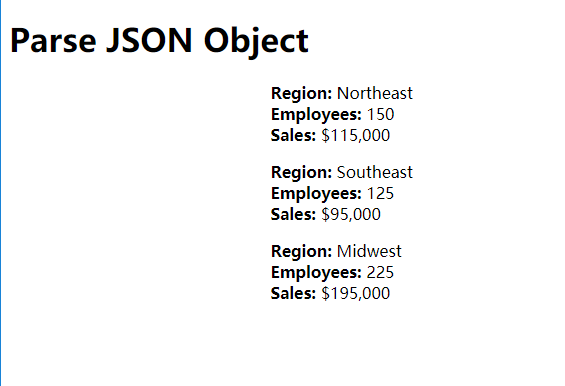
5.2 使用JSON.parse()方法访问,json_parse.html中,
<!doctype html>
<html>

    <head>
        <title>Parse JSON Object</title>
        <style>
            #dataRegion {
                width: 800px;
                margin: 1em auto;
            }
        </style>
    </head>

    <body>
        <h1>Parse JSON Object</h2>
        <div id="dataRegion">
        </div>
        <script>
            var jsonData = '{"regions":[' +
                '{"territory":"Northeast","employees":"150","amount":"115,000" },' +
                '{"territory":"Southeast","employees":"125","amount":"95,000" },' +
                '{"territory":"Midwest","employees":"225","amount":"195,000" },' +
                '{"territory":"West","employees":"325","amount":"265,000" }]}';

            //JSON.parse()将字符串解析为一个对象
            jsonObj = JSON.parse(jsonData);
            var theHTML = '';
            for(var i = 0; i < 3; i++) {
                theHTML += '<p><strong>Region: </strong>' + jsonObj.regions[i].territory + '<br/>';
                theHTML += '<strong>Employees: </strong>' + jsonObj.regions[i].employees + '<br/>';
                theHTML += '<strong>Sales: </strong>$' + jsonObj.regions[i].amount + '<br/>';
                theHTML += '</p>';
            };
            document.getElementById("dataRegion").innerHTML = theHTML;
        </script>
</body>
</html>
运行结果:
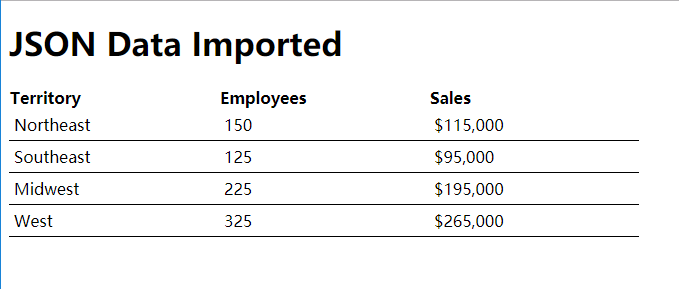
5.3 使用$.getJSON()方法访问,
regional_sales.json中,
{
  "sales": {
    "region": [
      {
        "year": "2013",
        "territory": "Northeast",
        "employees": "150",
        "amount": "115,000"
      },
      {
        "year": "2013",
        "territory": "Southeast",
        "employees": "125",
        "amount": "95,000"
      },
      {
        "year": "2013",
        "territory": "Midwest",
        "employees": "225",
        "amount": "195,000"
      },
      {
        "year": "2013",
        "territory": "West",
        "employees": "325",
        "amount": "265,000"
      }
    ]
  }
}
import_json.html中,
<!doctype html>
<html>

    <head>
        <meta charset="UTF-8">
        <title>JSON Data Imported</title>
        <script src="http://code.jquery.com/jquery-latest.js"></script>
        <style>
            table {
                border-collapse: collapse;
            }

            td {
                width: 200px;
                border-bottom: 1px solid #000;
                padding: 5px;
                margin: 0;
            }

            th {
                text-align: left;
            }
        </style>
    </head>

    <body>
        <h1>JSON Data Imported</h1>
        <table id="sales">
            <tr>
                <th>Territory</th>
                <th>Employees</th>
                <th>Sales</th>
            </tr>
        </table>
        <script>
            $(document).ready(function() {
                $.getJSON("regional_sales.json", function(data) {
                    $.each(data.sales.region, function(k, v) {
                        var theTerritory = v.territory;
                        var numEmployees = v.employees;
                        var theAmount = v.amount;
                        $('#sales').append('<tr><td>' + theTerritory + '</td><td>' + numEmployees + '</td><td>$' + theAmount + '</td></tr>');
                    });
                });
            });
        </script>
    </body>

</html>
运行结果:
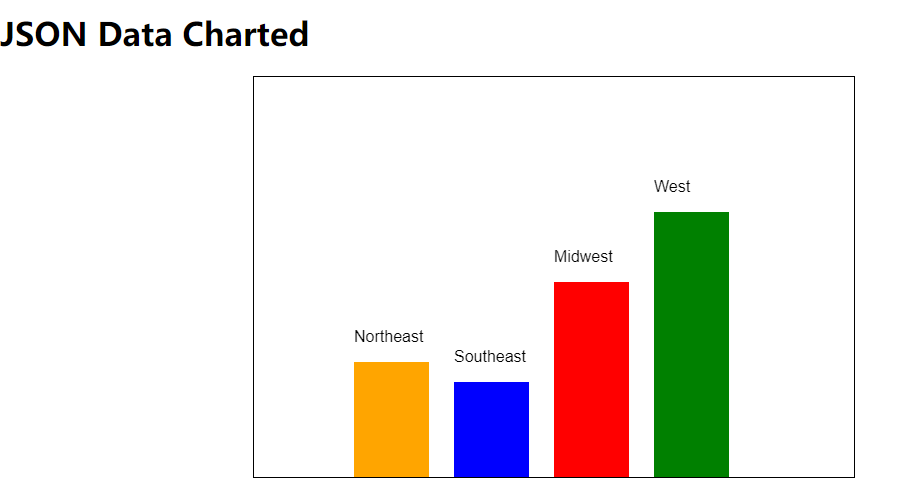
5.4 JSON数据在画布绘制图表,import_json_chart.html中
<!doctype html>
<html>

    <head>
        <meta charset="UTF-8">
        <title>JSON Data Charted</title>
        <script src="http://code.jquery.com/jquery-latest.js"></script>
        <style>
            #outerWrapper {
                width: 800px;
                margin: 1em auto;
            }

            canvas {
                border: 1px solid #000;
            }
        </style>
    </head>

    <body>
        <h1>JSON Data Charted</h1>
        <div id="outerWrapper">
            <canvas id="chart1" width="600" height="400"></canvas>
        </div>
        <script>
            $(document).ready(function() {
                var theChart = document.getElementById('chart1');
                var chartHeight = 400;
                var theWidth = 75;
                var theSpace = 100;
                var theX = 0;
                var theY = 0;
                var theFills = ['orange', 'blue', 'red', 'green'];
                var i = 0;

                if(theChart.getContext) {
                    var theContext = theChart.getContext('2d');
                    $.getJSON("regional_sales.json", function(data) {
                        $.each(data.sales.region, function(k, v) {
                            var theTerritory = v.territory;
                            var theHeight = parseInt(v.amount.replace(/,/g, '')) / 1000;
                            theY = chartHeight - theHeight;
                            theX = theX + theSpace;
                            theContext.fillStyle = theFills[i];
                            theContext.fillRect(theX, theY, theWidth, theHeight);
                            theContext.fillStyle = 'black';
                            theContext.font = '12pt Arial';
                            theContext.fillText(theTerritory, theX, theY - 20);
                            ++i;
                        });
                    });
                }
            });
        </script>
    </body>

</html>
运行结果:
正文结束~~~