VC# + GDI+ 绘制


using System;
using System.Collections.Generic;
using System.ComponentModel;
using System.Data;
using System.Drawing;
using System.Linq;
using System.Text;
using System.Threading.Tasks;
using System.Windows.Forms;

namespace WindowsFormsApplication1
{
    public partial class Form1 : Form
    {
        public Form1()
        {
            InitializeComponent();
        }

        private void Form1_Paint(object sender, PaintEventArgs e)
        {
            Graphics g = e.Graphics;


            //Pen pen = new Pen(Color.Red, 5);
            //Point point1 = new Point(10, 50);
            //Point point2 = new Point(100, 50);
            //g.DrawLine(pen, point1, point2);

            //Pen pen1 = new Pen(Color.Black, 3);
            //Point point3 = new Point(150, 30);
            //Point point4 = new Point(150, 100);
            //g.DrawLine(pen1, point3, point4);


            // Draw ellipse to screen.
            Pen pen = new Pen(Color.Gray, 5);
            Brush brush = new SolidBrush(Color.Gray);

            e.Graphics.DrawEllipse(pen, 100, 200, 30, 30);
            e.Graphics.FillEllipse(brush, 100, 200, 30, 30);

            e.Graphics.DrawEllipse(pen, 200, 200, 30, 30);
            e.Graphics.FillEllipse(brush, 200, 200, 30, 30);

            e.Graphics.DrawEllipse(pen, 300, 200, 30, 30);
            e.Graphics.FillEllipse(brush, 300, 200, 30, 30);

            e.Graphics.DrawLine(pen, 100+15, 200+15, 200 + 15, 200 + 15);


        }
    }
}

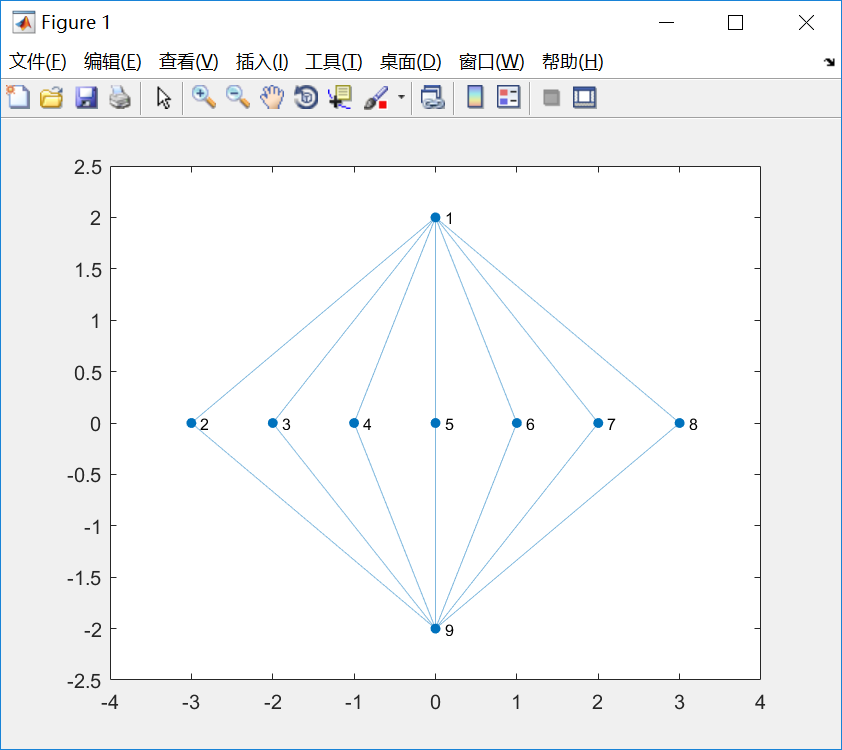
Matlab,使用graph的plot,可以设定点的位置,相对简单些
clc; clear;
s = [1 1 1 1 1 1 1 9 9 9 9 9 9 9];
t = [2 3 4 5 6 7 8 2 3 4 5 6 7 8];
G = graph(s,t);
h = plot(G)
h.XData = [0 -3 -2 -1 0 1 2 3 0];
h.YData = [2 0 0 0 0 0 0 0 -2];
调整节点位置,利用pause制作动画
clc; clear;
s = [1 1 2 4 5 6 1 2 3];
t = [2 3 3 7 8 9 4 5 6];
G = graph(s,t);
h = plot(G)
h.XData = [0 -1 1 -1  0  1 -1  0  1];
h.YData = [2  1 1 -1 -1 -1 -2 -2 -2];
h.LineWidth = 3;
h.MarkerSize = 8;

pause(0.2)

s = [1 1 2 4 5 6 1 2 3];
t = [2 3 3 7 8 9 5 4 6];
G = graph(s,t);
h = plot(G)
h.XData = [0 -1 1 -1  0  1 -1  0  1];
h.YData = [2  1 1 -1 -1 -1 -2 -2 -2];
h.LineWidth = 3;
h.MarkerSize = 8;

pause(0.5)

s = [1 1 2 4 5 6 1 2 3];
t = [2 3 3 7 8 9 6 5 4];
G = graph(s,t);
h = plot(G)
h.XData = [0 -1 1 -1  0  1 -1  0  1];
h.YData = [2  1 1 -1 -1 -1 -2 -2 -2];
h.LineWidth = 3;
h.MarkerSize = 8;

这儿有一个如何利用matlab制作gif图的教程。
https://blog.csdn.net/lusongno1/article/details/78632457
这个博客的方法好,提供了一个库函数
https://blog.csdn.net/qq_16635325/article/details/85726968
function savegif(varargin)
global iiii;
global time;
tip=0;
p=clock;
if isempty(varargin)
    filename='untitledgif.gif';
else
    filename=varargin{1};
    if length(filename)<4
        filename=[filename,'.gif'];
    else
        if ~strcmp(filename(end-3:end),'.gif')
            filename=[filename,'.gif'];
        end
    end
    if nargin>=2
        tip=1;
    end
end
if isempty(iiii)
    iiii=0;
    time=p(6);
else
    iiii=iiii+1;
    if ((p(6)>=time)*(p(6)-time)+(p(6)<time)*(p(6)+60-time))>100
        iiii=0;
    end
    time=p(6);
end
if tip ==0
    f=getframe(gca);%getframe(F)gets a frame from the current axes
else
    pos=get(gcf,'position');
    f=getframe(gcf,[1,1,pos(3),pos(4)]);
end
f=frame2im(f);
[f,map]=rgb2ind(f,256);
if iiii==0 || exist(filename,'file')==0
    imwrite(f,map,filename,...
        'delaytime',rand(1));
else
    imwrite(f,map,filename,'writemode','append',...
        'delaytime',rand(1));
end
绘制代码,做了5个拓扑快照
clc; clear;
a06 = 4;
a08 = 7;
a10 = 5;
a12 = 8;
a20 = 6;
a22 = 9;
for i=1:10
    s = [1 1 2  1    2  3   4 5 6];
    t = [2 3 3 a12 a22  a20 7 8 9];
    G = graph(s,t);
    h = plot(G);
    h.XData = [0 -0.5 0.5 -1+0.2  0+0.2  1+0.2 -1-0.2  0-0.2  1-0.2];
    h.YData = [2  0.5 0.5 -1 -1 -1 -2 -2 -2];
    h.LineWidth = 3;
    h.MarkerSize = 8;

    pause(0.01);savegif('dot');

    s = [1 1 2  1    2  3   4 5 6];
    t = [2 3 3 a06 a12  a10 7 8 9];
    G = graph(s,t);
    h = plot(G);
    h.XData = [0 -0.5 0.5 -1+0.2  0+0.2  1+0.2 -1-0.2  0-0.2  1-0.2];
    h.YData = [2  0.5 0.5 -1 -1 -1 -2 -2 -2];
    h.LineWidth = 3;
    h.MarkerSize = 8;

    pause(0.01);savegif('dot');

    s = [1 1 2  1    2  3   4 5 6];
    t = [2 3 3 a22 a08  a20 7 8 9];
    G = graph(s,t);
    h = plot(G);
    h.XData = [0 -0.5 0.5 -1+0.2  0+0.2  1+0.2 -1-0.2  0-0.2  1-0.2];
    h.YData = [2  0.5 0.5 -1 -1 -1 -2 -2 -2];
    h.LineWidth = 3;
    h.MarkerSize = 8;

    pause(0.01);savegif('dot');

    s = [1 1 2  1    2  3   4 5 6];
    t = [2 3 3 a20 a06  a08 7 8 9];
    G = graph(s,t);
    h = plot(G);
    h.XData = [0 -0.5 0.5 -1+0.2  0+0.2  1+0.2 -1-0.2  0-0.2  1-0.2];
    h.YData = [2  0.5 0.5 -1 -1 -1 -2 -2 -2];
    h.LineWidth = 3;
    h.MarkerSize = 8;

    pause(0.01);savegif('dot');

    s = [1 1 2  1    2  3   4 5 6];
    t = [2 3 3 a08 a10  a06 7 8 9];
    G = graph(s,t);
    h = plot(G);
    h.XData = [0 -0.5 0.5 -1+0.2  0+0.2  1+0.2 -1-0.2  0-0.2  1-0.2];
    h.YData = [2  0.5 0.5 -1 -1 -1 -2 -2 -2];
    h.LineWidth = 3;
    h.MarkerSize = 8;

    pause(0.01);savegif('dot');
end
生成的gif图