- 基本原理:
实质为利用球面参数方程,利用网格化数据绘制
x=R*sin(theta)*cos(phi)
y=R*sin(theta)*sin(phi)
z=R*cos(theta)
function draw_sphere(rgb)
%此函数旨在绘制各种颜色的球面
%rgb为颜色参数,为三个0~1之间的三个数组成的数组
%such as:    [1,0,0],  [1,0.2,0.5], [0,1,0.5]
%you may run as :  draw_sphere([1,0,0])
%author:   杨文波 12/16/2016
t=linspace(0,2*pi,100*pi);
p=linspace(0,2*pi,100*pi);
[theta,phi]=meshgrid(t,p);                  %网格化数据
R=1;                                        %设置球面半径
x=R*sin(theta).*cos(phi);                   %代入参数方程
y=R*sin(theta).*sin(phi);
z=R*cos(theta);
colormap(rgb);
surf(x,y,z);                                %绘制表面图
daspect([1,1,1]);                           %设置xyz轴比例为1:1:1
camlight;                                   %设置默认光照
shading interp;
axis off;                                   %隐藏坐标轴
end
figure(1)
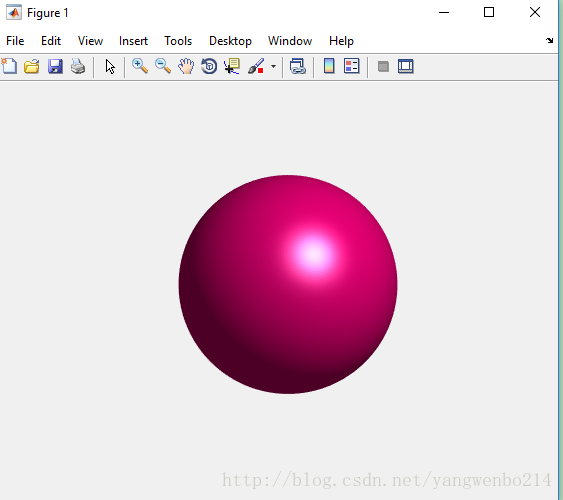
draw_sphere([1,0,0.5]);
figure(2)
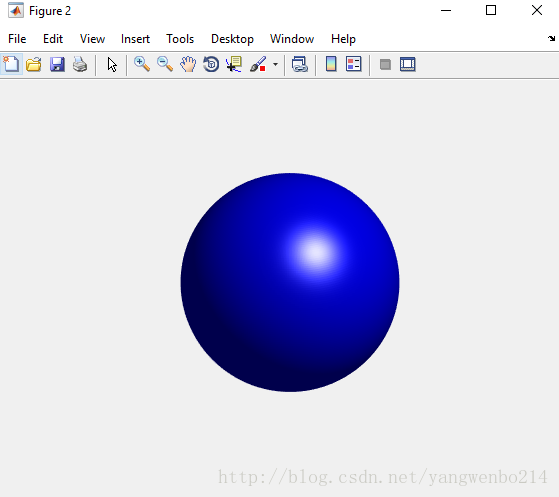
draw_sphere([0,0,1]);
NOTE:
不推荐使用subplot分割绘图,因为colormap作用域为整个figure
1.rgb=[1,0,0.5]时:
2.rgb=[0,0,1]时: