pandas基础知识汇总
1.时间序列
import pandas as pd
import numpy as np
import matplotlib.pyplot as plt
from datetime import datetime
now=datetime.now()
now
datetime.datetime(2018, 11, 18, 16, 44, 4, 405600)
print(now.strftime('%Y-%m-%d'))
print(datetime.strptime('7/6/2018','%m/%d/%Y'))
print(now.strftime('%X'))
2018-11-18
2018-07-06 00:00:00
16:44:04
dates=pd.date_range('11/1/2018',periods=50,freq='W-WED')
long_df=pd.DataFrame(np.random.randn(50,4),index=dates,columns=list('ABCD'))
long_df.head(10)
|
A |
B |
C |
D |
| 2018-11-07 |
0.215536 |
0.855986 |
0.737170 |
-0.440150 |
| 2018-11-14 |
-0.477099 |
0.467430 |
-0.107105 |
0.941922 |
| 2018-11-21 |
0.052926 |
-0.671084 |
0.219058 |
-0.350776 |
| 2018-11-28 |
-1.449668 |
0.003958 |
1.065875 |
-0.277673 |
| 2018-12-05 |
1.371631 |
0.542839 |
0.071466 |
0.609508 |
| 2018-12-12 |
0.322176 |
1.335534 |
-0.423240 |
-0.111549 |
| 2018-12-19 |
-0.564089 |
0.262918 |
0.477552 |
0.018652 |
| 2018-12-26 |
-0.490212 |
0.382492 |
-0.858712 |
-0.920786 |
| 2019-01-02 |
1.630409 |
-0.740542 |
1.296362 |
0.376437 |
| 2019-01-09 |
1.460070 |
-0.449293 |
-0.783725 |
-1.098911 |
resample=long_df.resample('M').mean()
resample
|
A |
B |
C |
D |
| 2018-11-30 |
-0.414576 |
0.164073 |
0.478750 |
-0.031669 |
| 2018-12-31 |
0.159876 |
0.630946 |
-0.183234 |
-0.101044 |
| 2019-01-31 |
0.092189 |
-0.225606 |
0.251072 |
-0.456075 |
| 2019-02-28 |
-0.124615 |
-0.467522 |
-0.142258 |
0.195602 |
| 2019-03-31 |
-0.294693 |
-0.014264 |
0.725285 |
1.291576 |
| 2019-04-30 |
0.182648 |
0.231022 |
-0.458572 |
0.294329 |
| 2019-05-31 |
0.317648 |
0.060677 |
0.297406 |
-0.035691 |
| 2019-06-30 |
0.407404 |
-0.198072 |
-0.461785 |
1.074969 |
| 2019-07-31 |
-0.245908 |
0.150161 |
0.526564 |
-0.082258 |
| 2019-08-31 |
0.046819 |
-0.227364 |
-0.684359 |
0.033979 |
| 2019-09-30 |
-0.834454 |
1.186670 |
0.653583 |
-0.306585 |
| 2019-10-31 |
-0.436990 |
-0.460347 |
0.040175 |
0.681903 |
pd.date_range('11/18/2018',periods=10,freq='2h30min')
DatetimeIndex(['2018-11-18 00:00:00', '2018-11-18 02:30:00',
               '2018-11-18 05:00:00', '2018-11-18 07:30:00',
               '2018-11-18 10:00:00', '2018-11-18 12:30:00',
               '2018-11-18 15:00:00', '2018-11-18 17:30:00',
               '2018-11-18 20:00:00', '2018-11-18 22:30:00'],
              dtype='datetime64[ns]', freq='150T')
type(resample)
pandas.core.resample.DatetimeIndexResampler
ts=pd.Series(np.arange(10),index=pd.date_range('11/18/2018',periods=10,freq='T'))
ts
2018-11-18 00:00:00    0
2018-11-18 00:01:00    1
2018-11-18 00:02:00    2
2018-11-18 00:03:00    3
2018-11-18 00:04:00    4
2018-11-18 00:05:00    5
2018-11-18 00:06:00    6
2018-11-18 00:07:00    7
2018-11-18 00:08:00    8
2018-11-18 00:09:00    9
Freq: T, dtype: int32
#pay attention to the parameter 'closed'
ts.resample('3min',closed='left',label='left').sum()
2018-11-18 00:00:00     3
2018-11-18 00:03:00    12
2018-11-18 00:06:00    21
2018-11-18 00:09:00     9
Freq: 3T, dtype: int32
ts.resample('3min').ohlc()
|
open |
high |
low |
close |
| 2018-11-18 00:00:00 |
0 |
2 |
0 |
2 |
| 2018-11-18 00:03:00 |
3 |
5 |
3 |
5 |
| 2018-11-18 00:06:00 |
6 |
8 |
6 |
8 |
| 2018-11-18 00:09:00 |
9 |
9 |
9 |
9 |
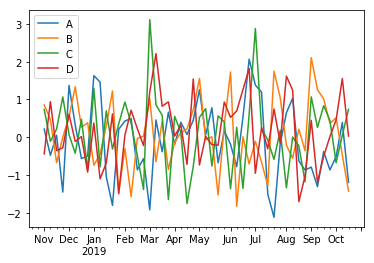
long_df.plot()
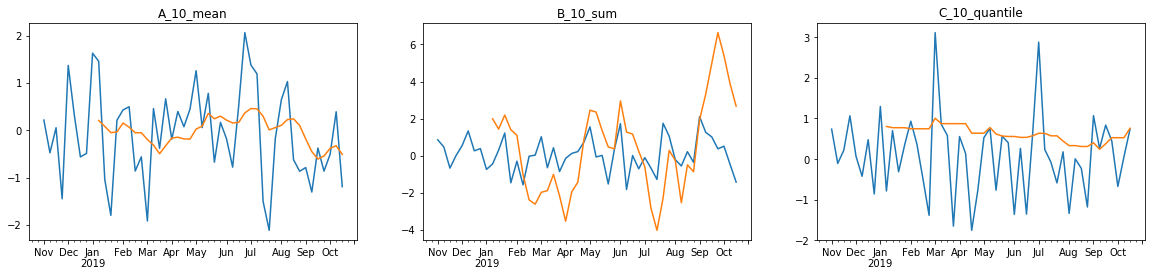
## 滑窗函数
fig,axes=plt.subplots(1,3,figsize=(20,4))
long_df['A'].plot(ax=axes[0])
long_df['A'].rolling(window=10).mean().plot(ax=axes[0],title='A_10_mean')
long_df['B'].plot(ax=axes[1])
long_df['B'].rolling(window=10).sum().plot(ax=axes[1],title='B_10_sum')
long_df['C'].plot(ax=axes[2])
long_df['C'].rolling(window=10).quantile(quantile=0.8).plot(ax=axes[2],title='C_10_quantile')
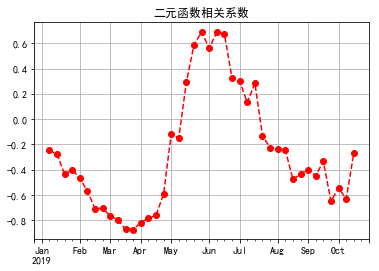
#corr
from pylab import mpl
mpl.rcParams['font.sans-serif'] = ['SimHei'] # 指定默认字体
mpl.rcParams['axes.unicode_minus'] = False # 解决保存图像是负号'-'显示为方块的问题
long_df['B'].rolling(window=10).corr(long_df['A']).plot(style='ro--',grid=True,title='二元函数相关系数')
2.matplotlib绘图
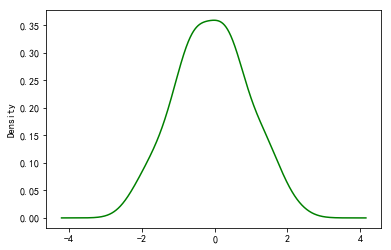
long_df['A'].plot(kind='kde',style='g')
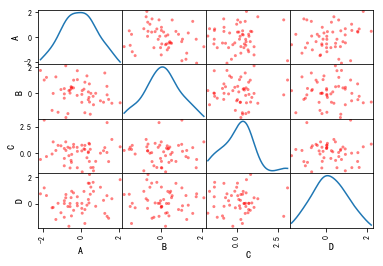
pd.plotting.scatter_matrix(long_df,diagonal='kde',color='r')
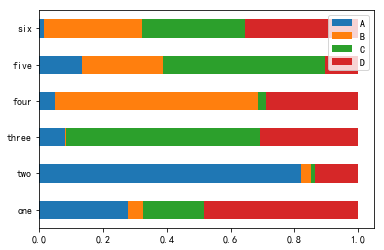
df=pd.DataFrame(np.random.randn(6,4),index='one two three four five six'.split(' '),columns=list('ABCD'))
df_normal=abs(df).div(abs(df).sum(1),axis=0)
df_normal.plot(kind='barh',stacked=True)
abs(df).sum(1)
one      3.989060
two      1.160160
three    2.087209
four     2.680116
five     4.452365
six      2.298789
dtype: float64