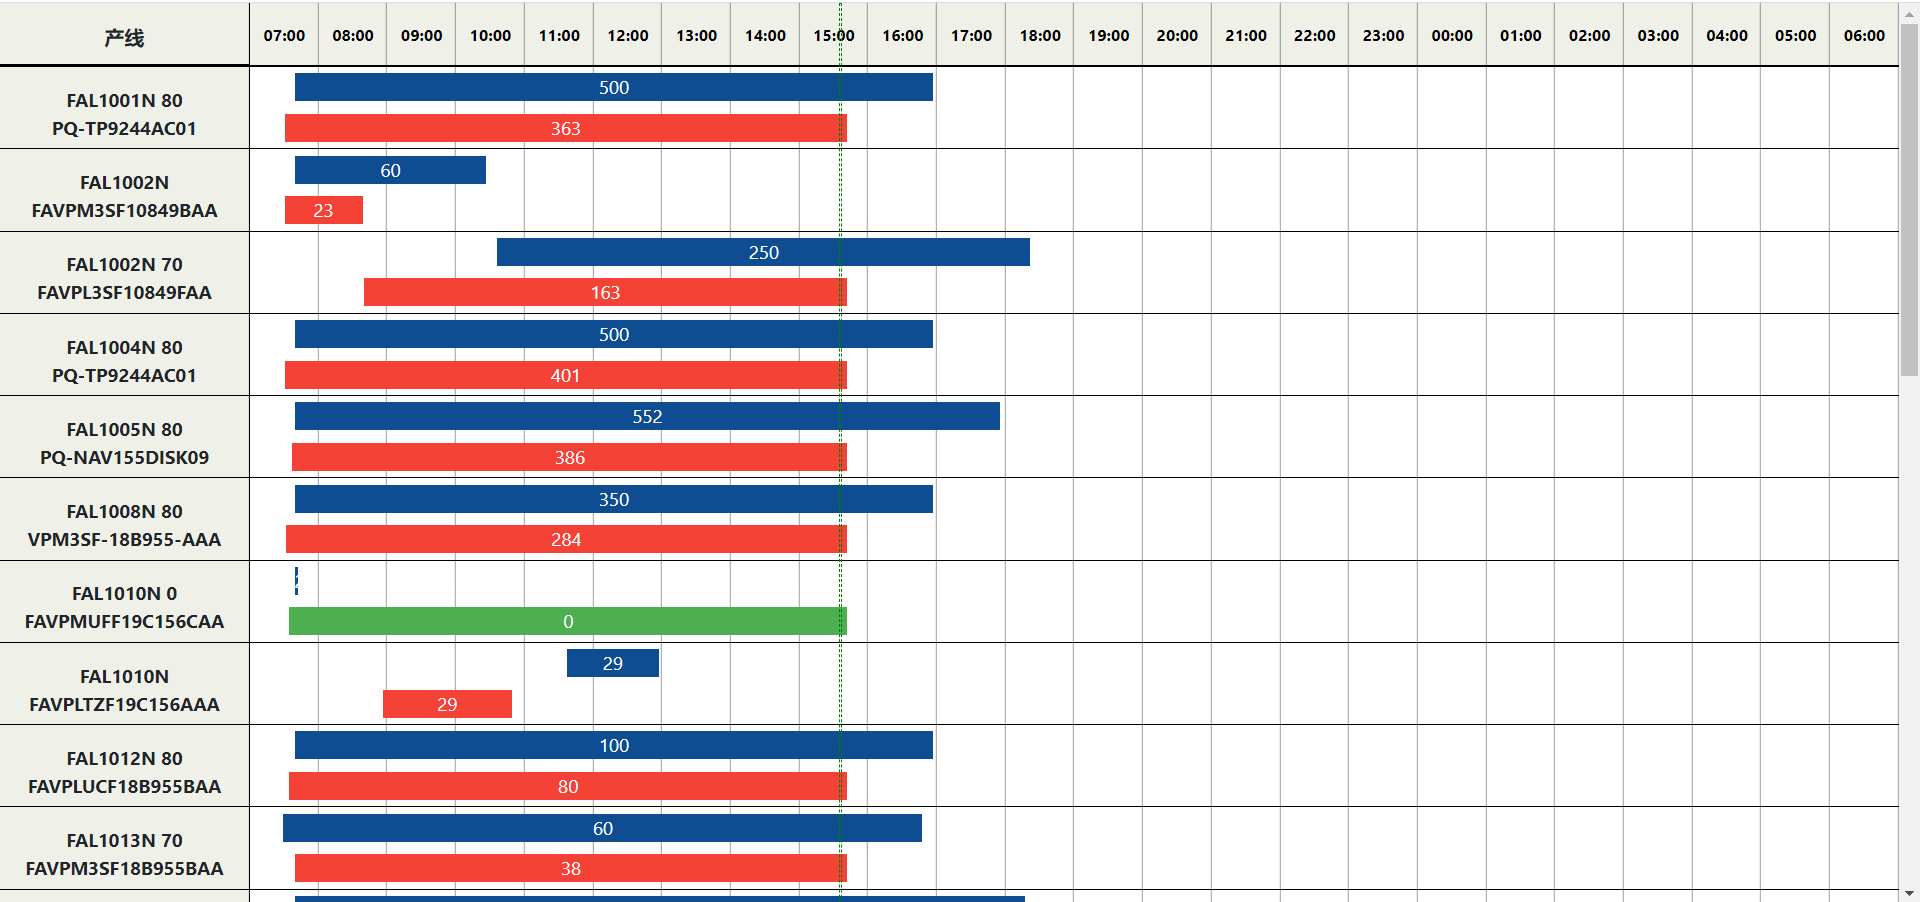
Gantt/BTS 生产计划电子看板甘特图
前言
参考:https://www.freecodecamp.org/news/create-gantt-chart-using-css-grid/
“甘特图是一种用于说明项目进度的条形图。该图表在纵轴上列出了要执行的任务,在横轴上列出了时间间隔。图中水平条的宽度显示了每项活动的持续时间。” – 维基百科
成品
计算思路
首先生成 7:00 - 6:00 24小时时间表头
generateTimeRange () {
      // let h1 = parseInt(start.substring(0, 2))
      let timeRange = []
      for (let i = 7; i < 24; i++) {
        timeRange.push((i < 10 ? '0' + i : i) + ':' + '00')
        this.timeRangeOrigin.push(i)
      }
      for (let i = 0; i < 7; i++) {
        timeRange.push((i < 10 ? '0' + i : i) + ':' + '00')
        this.timeRangeOrigin.push(i)
      }
      return timeRange
    },

如第一条Item,30和0这两个条状图像,时间范围分别是 7:40 - 8:12 和 7:30 - 8:30
如何让条状图形正好偏移到时间点呢?
首先需要一个存储所以时间的数组,为了方便查找,里面的数据大概为: [7,8,9,10,11 .... 6]
以第二条为例:

180 这一条的起始时间为 2021-06-03 08:22:46 - 2021-06-03 11:49:15
我们先来计算宽度,这个180该多长:
let width = ((endIdx - startIdx) === 0 ? 1 : (endIdx - startIdx)) * this.itemWidth
endIdx 和 startIdx 为结束时间的分钟在数组中的下标,itemWidth为每个单元格的宽度
那么上面的时间区间就是 (4 - 1) * 150 大约三个单元格的宽度
那么再进行时间偏移
180 的起始时间是8点,也就是需要跳跃7这个单元格到8,分钟时22分,那么算出偏移量
(单元格宽度 / 60) * 分钟数 = 偏移量
 getOffset (minute) {
      return (this.itemWidth / 60) * minute
    },
那么最后还要处理一下宽度,这个时候的结束时间位置应该时不正确的。
let style = '' + ((width - this.getOffset(parseInt(m1)) + this.getOffset(parseInt(m2))) - this.itemWidth) + 'px;'
最终宽度为: ((宽度 - 左偏移量 ) + 右偏移量) - 一个单元格宽度
完整计算如下:
 getBarStyleVersion2 (flag, startTime, endTime) {
      let s = this.getMinutes(this.getTimestamp(startTime))
      let h1 = parseInt(s.substring(0, 2))
      let m1 = s.substring(s.indexOf(':') + 1, s.indexOf(':') + 3)
      let m2
      let h2
      if (endTime !== null) {
        let e = this.getMinutes(this.getTimestamp(endTime))
        h2 = parseInt(e.substring(0, 2))
        m2 = e.substring(s.indexOf(':') + 1, e.indexOf(':') + 3)
      } else {
        h2 = h1
        m2 = m1
      }
      let temp
      if (h1 > h2) {
        temp = h1
        h1 = h2
        h2 = temp
      }
      let startIdx = this.getTimeIdx(h1)

      let endIdx = this.getTimeIdx(h2) + 1
      // 计算长度
      // // console.log(startIdx)
      // // console.log(endIdx)
      // // console.log('w:' + ((endIdx - startIdx) === 0 ? 1 : (endIdx - startIdx)) * this.itemWidth)

      let width = ((endIdx - startIdx) === 0 ? 1 : (endIdx - startIdx)) * this.itemWidth
      // console.log('offset:' + this.getOffset(parseInt(m1)))
      let marginLeft = 0

      if (startIdx > 0) {
        marginLeft = (this.itemWidth * startIdx) + this.getOffset(parseInt(m1))
      } else {
        marginLeft = this.getOffset(parseInt(m1))
      }

      let style = '' + ((width - this.getOffset(parseInt(m1)) + this.getOffset(parseInt(m2))) - this.itemWidth) + 'px;'
      // 计算margin
      style += 'margin-left:' + marginLeft + 'px;'
      // 计算偏移

      // console.log('m1: -> ' + m1)
      // console.log('w: -> ' + this.itemWidth)
      // // console.log('m2: -> ' + m2)
      // // console.log(s)
      if (flag === 0) {
        style += 'background-color:#4F97A3;'
      } else {
        style += 'background-color:#0E4D92;'
      }
      return style
    },
    getOffset (minute) {
      return (this.itemWidth / 60) * minute
    },
时间轴
就是图中的绿色竖线,代表当前时间。
首先一个DIV
然后生成样式:
    getNowLine () {
      let styles = 'border:1px dashed green;height: 900px; 1px; position: fixed;z-index:999;'
      let now = this.getMinutes(Date.parse(new Date()))
      let m1 = parseInt(now.substring(0, 2))
      let s1 = parseInt(now.substring(now.indexOf(':') + 1, now.indexOf(':') + 3))
      let idx = this.getTimeIdx(m1)

      styles += 'margin-left:' + ((this.itemWidth * (idx + 1)) + (150 - (60 - this.getOffset(s1)))) + 'px'
      // console.log(idx)
      return styles
    }
偏移量计算为 (单元格长度 * (小时数下标 + 1)) + (左侧固定栏宽度 - (60分钟 - 分钟数下标偏移量))