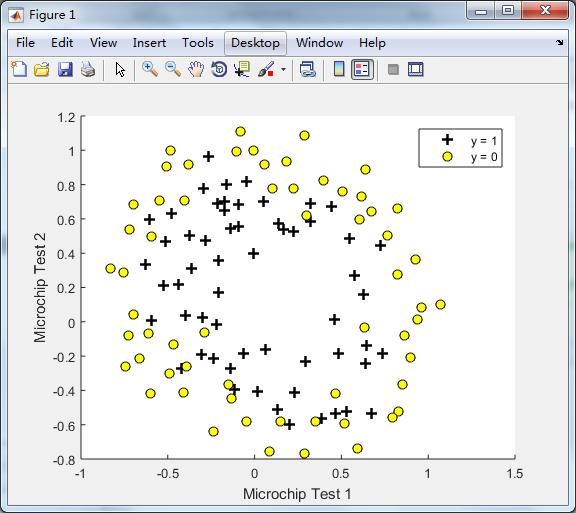
Regularized logistic regression : plot data(画样本图)
ex2data2.txt
0.051267,0.69956,1
-0.092742,0.68494,1
-0.21371,0.69225,1
-0.375,0.50219,1
-0.51325,0.46564,1
-0.52477,0.2098,1
-0.39804,0.034357,1
-0.30588,-0.19225,1
0.016705,-0.40424,1
0.13191,-0.51389,1
0.38537,-0.56506,1
...........................
ex2_reg.m
%% Machine Learning Online Class - Exercise 2: Logistic Regression
%
% Instructions
% ------------
%
% This file contains code that helps you get started on the second part
% of the exercise which covers regularization with logistic regression.
%
% You will need to complete the following functions in this exericse:
%
% sigmoid.m
% costFunction.m
% predict.m
% costFunctionReg.m
%
% For this exercise, you will not need to change any code in this file,
% or any other files other than those mentioned above.
%
%% Initialization
clear ; close all; clc (clear: Clear variables and functions from memory; close: close figure; clc: Clear command window.)
%% Load Data
% The first two columns contains the X values and the third column
% contains the label (y).
data = load('ex2data2.txt');
X = data(:, [1, 2]); y = data(:, 3);
plotData(X, y); %调用下面的plotData.m里面的函数plotData(X,y)
% Put some labels
hold on;
% Labels and Legend
xlabel('Microchip Test 1')
ylabel('Microchip Test 2')
% Specified in plot order
legend('y = 1', 'y = 0')
hold off;
plotData.m文件
function plotData(X, y) (在文件的开头应写上新定义的function,文件的名称(plotData.m)中的plotData应与function的名称一至)
%PLOTDATA Plots the data points X and y into a new figure
% PLOTDATA(x,y) plots the data points with + for the positive examples
% and o for the negative examples. X is assumed to be a Mx2 matrix.
% Create New Figure
figure; hold on; (figure:创建一个figure 窗口)
% ====================== YOUR CODE HERE ======================
% Instructions: Plot the positive and negative examples on a
% 2D plot, using the option 'k+' for the positive
% examples and 'ko' for the negative examples.
%
% Find indices of positive and negative example
pos = find(y==1); neg = find(y==0); (返回所有y==1的点的线性序列(linear indices (如上述data则返回(1,2,3,4,5,6...)))
%plot example
plot(X(pos,1), X(pos,2), 'k+', 'LineWidth', 2, 'MarkerSize', 7); (将相应序列对应的X矩阵的元素画出(如第4行的第一列的值做为x轴的值,第4行的第二列的值做为y轴的值); k+表示线的颜色为黑色,形状为+; MarkerSize 表示+形状的大小 )
plot(X(neg,1), X(neg,2), 'ko', 'MarkerFaceColor', 'y', 'MarkerSize', 7); (MarkerFaceColor: 表示填充在o里面的颜色为黄色)
% =========================================================================
hold off;
end (表示plotData(X, y)函数的结束)