1.简介
官网地址:https://www.elastic.co/cn/
官网权威指南:https://www.elastic.co/guide/cn/elasticsearch/guide/current/index.html
安装指南:https://www.elastic.co/guide/en/elasticsearch/reference/5.x/rpm.html
本文word文档以及安装包下载链接:
ELK是Elasticsearch、Logstash、Kibana的简称,这三者是核心套件,但并非全部。
Elasticsearch是实时全文搜索和分析引擎,提供搜集、分析、存储数据三大功能;是一套开放REST和JAVA API等结构提供高效搜索功能,可扩展的分布式系统。它构建于Apache Lucene搜索引擎库之上。
Logstash是一个用来搜集、分析、过滤日志的工具。它支持几乎任何类型的日志,包括系统日志、错误日志和自定义应用程序日志。它可以从许多来源接收日志,这些来源包括 syslog、消息传递(例如 RabbitMQ)和JMX,它能够以多种方式输出数据,包括电子邮件、websockets和Elasticsearch。
Kibana是一个基于Web的图形界面,用于搜索、分析和可视化存储在 Elasticsearch指标中的日志数据。它利用Elasticsearch的REST接口来检索数据,不仅允许用户创建他们自己的数据的定制仪表板视图,还允许他们以特殊的方式查询和过滤数据
Redis REmote DIctionary Server(Redis) 是一个由Salvatore Sanfilippo写的key-value存储系统。
Redis是一个开源的使用ANSI C语言编写、遵守BSD协议、支持网络、可基于内存亦可持久化的日志型、Key-Value数据库,并提供多种语言的API。
它通常被称为数据结构服务器,因为值(value)可以是 字符串(String), 哈希(Hash), 列表(list), 集合(sets) 和 有序集合(sorted sets)等类型,在ELK套件中作为数据临时存储的作用。
Filebeat是本地文件的日志数据采集器。 作为服务器上的代理安装,Filebeat监视日志目录或特定日志文件,tail file,并将它们转发给Elasticsearch或Logstash进行索引、kafka 等。
2.本次使用框架

3.安装
3.1 filebeat安装
安装包:
filebeat-5.6.0-linux-x86_64.tar.gz
tar -xzvf  filebeat-5.6.0-linux-x86_64.tar.gz
mv  filebeat-5.6.0-linux-x86_64  filebeat
cd filebeat
编辑配置文件--> filebeat.yml
添加收集日志文件,导入redis
##input
#------------------------------ Log prospector --------------------------------
- input_type: log

  # Paths that should be crawled and fetched. Glob based paths.
  # To fetch all ".log" files from a specific level of subdirectories
  # /var/log/*/*.log can be used.
  # For each file found under this path, a harvester is started.
  # Make sure not file is defined twice as this can lead to unexpected behaviour.
  paths:
    - /var/log/*.log
    #- c:programdataelasticsearchlogs*
##output
#------------------------------- Redis output ----------------------------------
output.redis:
  # Boolean flag to enable or disable the output module.
  enabled: true
  # The list of Redis servers to connect to. If load balancing is enabled, the
  # events are distributed to the servers in the list. If one server becomes
  # unreachable, the events are distributed to the reachable servers only.
  hosts: ["192.168.1.110"]
  # The Redis port to use if hosts does not contain a port number. The default
  # is 6379.
  port: 6379
  # The name of the Redis list or channel the events are published to. The
  # default is filebeat.
  key: filebeat
  # The password to authenticate with. The default is no authentication.
  password: xian123
  # The Redis database number where the events are published. The default is 0.
  db: 0
  # The Redis data type to use for publishing events. If the data type is list,
  # the Redis RPUSH command is used. If the data type is channel, the Redis
  # PUBLISH command is used. The default value is list.
  datatype: list
  # The number of workers to use for each host configured to publish events to
  # Redis. Use this setting along with the loadbalance option. For example, if
  # you have 2 hosts and 3 workers, in total 6 workers are started (3 for each
  # host).
  worker: 1
  # If set to true and multiple hosts or workers are configured, the output
  # plugin load balances published events onto all Redis hosts. If set to false,
  # the output plugin sends all events to only one host (determined at random)
  # and will switch to another host if the currently selected one becomes
  # unreachable. The default value is true.
  loadbalance: true
  # The Redis connection timeout in seconds. The default is 5 seconds.
  timeout: 5s
  # The number of times to retry publishing an event after a publishing failure.
  # After the specified number of retries, the events are typically dropped.
  # Some Beats, such as Filebeat, ignore the max_retries setting and retry until
  # all events are published. Set max_retries to a value less than 0 to retry
  # until all events are published. The default is 3.
  #max_retries: 3
redis安装
安装包:
redis-5.0.4.tar.gz
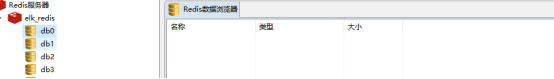
tar -xzvf redis-5.0.4.tar.gz
cd redis-5.0.4
Make && make install

Vi redis.conf
设置绑定端口bind ip,密码requirepass “密码”
启动 cd src
./redis-server ../redis.conf  &
启动filebeat
cd /home/elk/filebeat
 ./filebeat -e -c filebeat.yml > /dev/null  &
查看redis是否有日志

如有数据表示可以收集日志并导入redis,如无数据表示安装配置有问题;
下面是安装elasticsearch,建议内存够大,因为这个组件极耗内存
安装jdk
tar -xvzf jdk-8u91-linux-x64.tar.gz
ln -s /home/elk/jdk1.8.0_91 /usr/local/jdk
编辑环境变量
vim /etc/profile
JAVA_HOME=/usr/local/jdk
export JRE_HOME=/usr/local/jdk/jre/
export CLASSPATH=.:$JAVA_HOME/lib:$JRE_HOME/lib:$CLASSPATHexport PATH=$PATH:$JAVA_HOME/bin:$JRE_HOME/bin

验证:
#Java -version
java version "1.8.0_91"
Java(TM) SE Runtime Environment (build 1.8.0_91-b14)
Java HotSpot(TM) 64-Bit Server VM (build 25.91-b14, mixed mode)

安装elasticsearch
Unzip elasticsearch-5.6.3.zip
mv elasticsearch-5.6.3 elasticsearch
cd elasticsearch/config/
vi elasticsearch.yml
# ======================== Elasticsearch Configuration =========================
#
# NOTE: Elasticsearch comes with reasonable defaults for most settings.
#       Before you set out to tweak and tune the configuration, make sure you
#       understand what are you trying to accomplish and the consequences.
#
# The primary way of configuring a node is via this file. This template lists
# the most important settings you may want to configure for a production cluster.
#
# Please consult the documentation for further information on configuration options:
# https://www.elastic.co/guide/en/elasticsearch/reference/index.html
#
# ---------------------------------- Cluster -----------------------------------
#
# Use a descriptive name for your cluster:
#
cluster.name: my-application
#
# ------------------------------------ Node ------------------------------------
#
# Use a descriptive name for the node:
#
node.name: test-server
#
# Add custom attributes to the node:
#
#node.attr.rack: r1
#
# ----------------------------------- Paths ------------------------------------
#
# Path to directory where to store the data (separate multiple locations by comma):
#
path.data: /opt/data/
#
#Path to log files:
#
path.logs: /opt/logs
#
# ----------------------------------- Memory -----------------------------------
#
# Lock the memory on startup:
#
#bootstrap.memory_lock: false
#
# Make sure that the heap size is set to about half the memory available
# on the system and that the owner of the process is allowed to use this
# limit.
#
# Elasticsearch performs poorly when the system is swapping the memory.
#
# ---------------------------------- Network -----------------------------------
#
# Set the bind address to a specific IP (IPv4 or IPv6):
#
network.host: 0.0.0.0
#
# Set a custom port for HTTP:
#
http.port: 9200
#
# For more information, consult the network module documentation.
#
# --------------------------------- Discovery ----------------------------------
#
# Pass an initial list of hosts to perform discovery when new node is started:
#The default list of hosts is ["192.168.1.100",]
#
discovery.zen.ping.unicast.hosts: ["192.168.1.100",]
#
# Prevent the "split brain" by configuring the majority of nodes (total number of master-eligible nodes / 2 + 1):
#
#discovery.zen.minimum_master_nodes: 3
#
# For more information, consult the zen discovery module documentation.
#
# ---------------------------------- Gateway -----------------------------------
#
# Block initial recovery after a full cluster restart until N nodes are started:
#
#gateway.recover_after_nodes: 3
#
# For more information, consult the gateway module documentation.
#
# ---------------------------------- Various -----------------------------------
http.cors.enabled: true
http.cors.allow-origin: "*"
bootstrap.memory_lock: false
bootstrap.system_call_filter: false
#
# Require explicit names when deleting indices:
#
#action.destructive_requires_name: true


修改系统参数,不修改可能达到系统瓶颈,导致软件崩溃
vi /etc/sysctl.conf
vm.max_map_count=655360
sysctl –p
 vi /etc/security/limits.conf
*   soft    nofile  65536
*   hard        nofile  131072
*   soft        nproc   65536
*   hard        nproc   131072
Vi /etc/security/limits.d/20-nproc.conf
elk     soft    nproc       65536
启动组件
cd /home/elk/elasticsearch/bin/
 ./elasticsearch  >> /dev/null &
验证是否成功
Curl http://192.168.1.100:9200/_search?pretty

接口有数据表示启动没问题
安装logstash:
tar -xzvf logstash-5.3.1.tar.gz
创建软链接
ln -s /home/elk/logstash-5.3.1 /usr/local/logstash
验证
/usr/local/logstash/bin/logstash -e 'input { stdin { } } output { stdout {} }'
建立配置文件
vi /usr/local/logstash/config/logstash-simple.conf
input { stdin { } }
output {
    stdout { codec=> rubydebug }
}
使用logstash参数-f读取配置文件进行测试:
/usr/local/logstash/bin/logstash -f /usr/local/logstash/config/logstash-simple.conf

创建配置文件获取redis日志的数据:
配置文件如下:
vi /usr/local/logstash/config/redis-spring.conf
input {
  redis {
    port => "6379"
    host => "192.168.1.110"    ###redis服务器
    data_type => "list"
    password => "xian123"
    type => "log"
    key => "filebeat"
    db => "0"
  }
}
output {
  elasticsearch
     hosts => "192.168.1.100:9200"   ##
     index => "logstash1-%{+YYYY.MM.dd}"
  }
}
~  通过配置文件启动服务查看效果:
/usr/local/logstash/bin/logstash -f /usr/local/logstash/config/redis-spring.conf
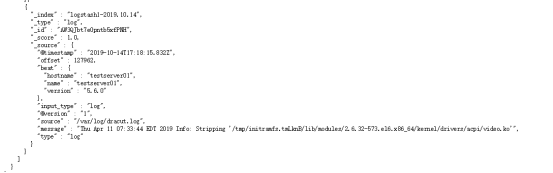
Redis的数据已经被取完
http://192.168.1.100:9200/_search?pretty 验证url
安装ES插件:(elasticsearch-head)
需要联网
xz node-v8.0.0-linux-x64.tar.xz
tar -xvf xz ode-v8.0.0-linux-x64.tar
cd node-v8.0.0-linux-x64
[root@test-server bin]# ln -s /home/elk/node-v8.0.0-linux-x64/bin/node /usr/local/bin/node
[root@test-server bin]# ln -s /home/elk/node-v8.0.0-linux-x64/bin/npm /usr/local/bin/npm

tar -xvjf  phantomjs-2.1.1-linux-x86_64.tar.bz2
 cd /home/elk/phantomjs-2.1.1-linux-x86_64/bin/
ln -s /home/elk/phantomjs-2.1.1-linux-x86_64/bin/phantomjs /usr/local/bin/phantomjs

unzip master.zip
cd elasticsearch-head-master
npm install -g cnpm --registry=https://registry.npm.taobao.org
npm install grunt --save
npm install -g cnpm --registry=https://registry.npm.taobao.org
npm install grunt --save
npm install grunt-contrib-clean --registry=https://registry.npm.taobao.org
npm install grunt-contrib-concat --registry=https://registry.npm.taobao.org
npm install grunt-contrib-watch --registry=https://registry.npm.taobao.org
npm install grunt-contrib-connect --registry=https://registry.npm.taobao.org
npm install grunt-contrib-copy --registry=https://registry.npm.taobao.org
npm install grunt-contrib-jasmine --registry=https://registry.npm.taobao.org

npm  install
npm run start &
查看端口状态:(端口默认9100)
netstat –anpt | grep 9100
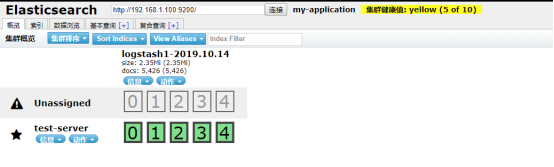
查看是否有日志:

安装kibana
tar -xzvf kibana-5.6.8-linux-x86_64.tar.gz

 cd kibana-5.6.8-linux-x86_64

按需修改配置文件

vi config/kibana.yml
按需修改配置文件

浏览器打开:http://IP:5601
配置获取Elasticsearch日志


创建完index之后返回看看是否有日志
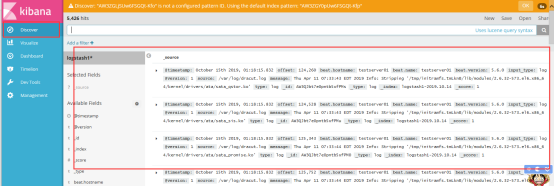
如上图表示已经获取到日志并展示;