1、重点注意(重要)
如果是wamp,那么请通过wamp打开php.ini文件,不要自己去找php文件夹下的php.ini,这是两个不同的文件
2、开始配置php.ini
zend_extension = "d:/wamp/bin/php/php5.5.12/zend_ext/php_xdebug-2.2.5-5.5-vc11.dll";
[xdebug]
xdebug.remote_enable = 1
xdebug.remote_handler = "dbgp"
xdebug.remote_host= "localhost"
xdebug.remote_mode="req"
xdebug.remote_port=9000
xdebug.profiler_enable = on
xdebug.profiler_enable_trigger = 0
xdebug.profiler_output_name = cachegrind.out.%t.%p
xdebug.profiler_output_dir = "d:/wamp/tmp"
xdebug.show_local_vars=0
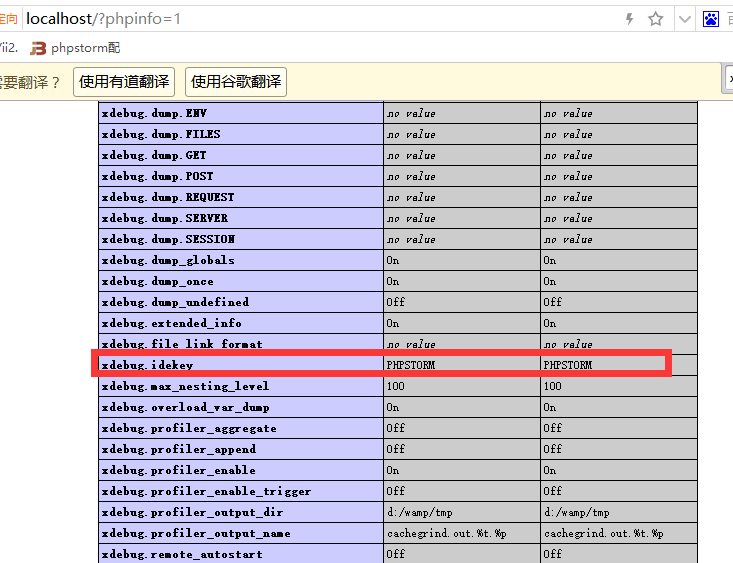
xdebug.idekey="PHPSTORM"
是否配置成功观察这个参数:phpinfo
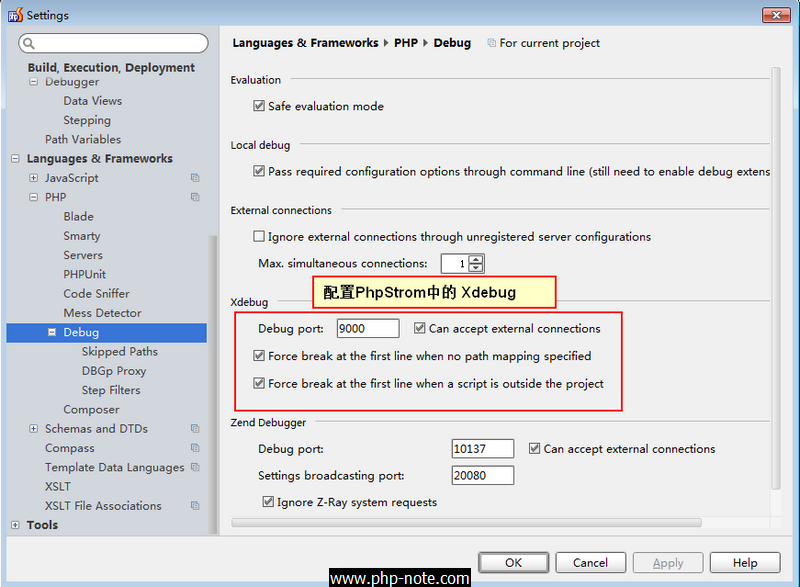
3:配置PhpStorm中的 XDebug
路径:File -> Settings -> Languages & Frameworks -> PHP -> Debug
4:配置PhpStorm中的 Server
路径:File -> Settings -> Languages & Frameworks -> PHP -> Servers
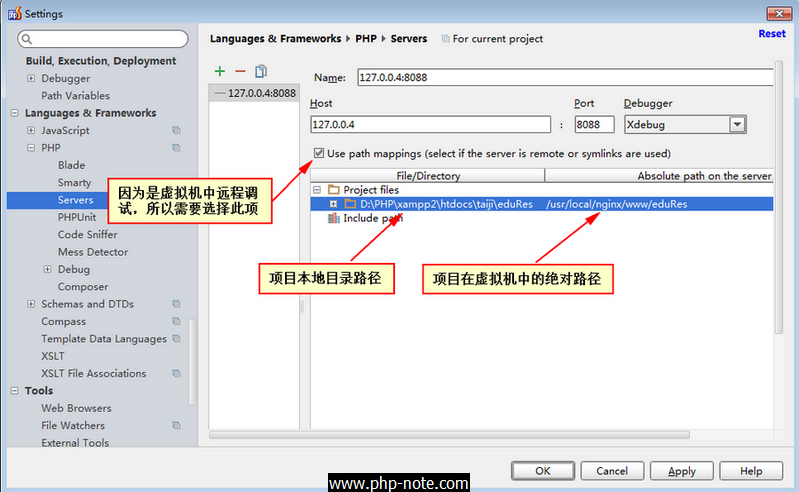
注意:如果所谓的"远程服务器"就在本地的话,就不需要勾选"Use path mappings(select if the servers is remote or symlinks are used)"
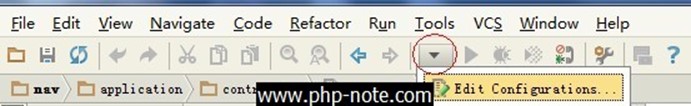
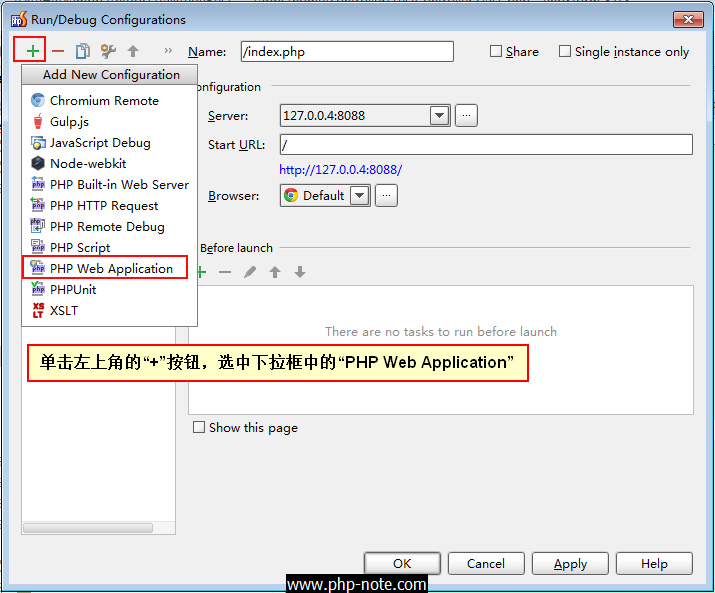
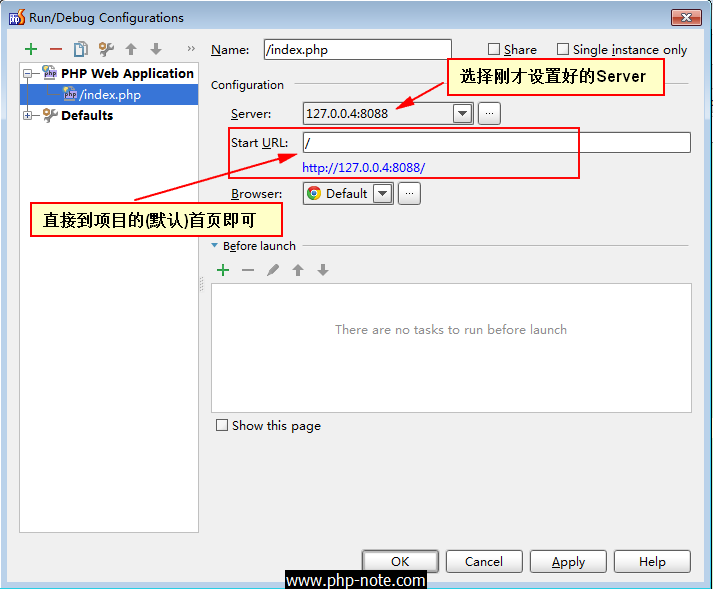
5:设置调试项
点击 如下图所示的"下三角"按钮,选择 "Edit Configurations",弹出"Run/Debug Configrations"对话框:
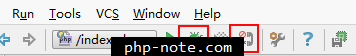
6 :点击工具栏上的"电话按钮",开启调试端口的监听,然后点击"甲壳虫按钮",开始调试页面。
特别说明下:因为刚才设置的是:开启调试的时候,打开项目的"首页",所以当点击"甲壳虫按钮"后,它会打开"首页"。
不用管它打开了"首页",上面的动作只是为了开启PhpStorm的调试监听功能,当我们在浏览器中输入要调试的页面时(记得按"回车键"),如页面 http://127.0.0.4:8088/home/Test/test,它会自动跳转页面的断点处,如下图所示:
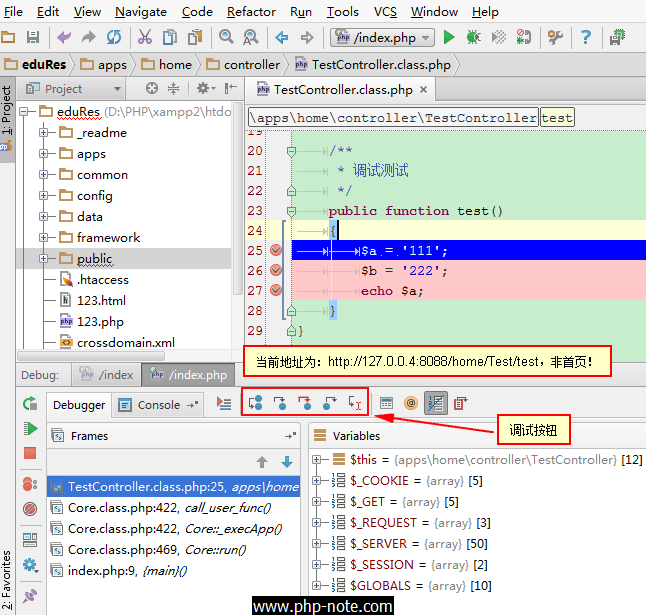
点击调试按钮,一步一步调试吧(快捷键 F5)!
常用的几个快捷键
F5:Step Into
F6:Step Over
F7:Step Out