Abstract
目的:实现一个测评TSDB(time series databases)的标准系统
成果:IoTDB-Bencmark框架
方法:
1. 总结了几种特殊的Data ingestion scenarios
2. 10种基本查询类型
实验:
在4个TSDB系统上进行测评-InfluxDB, OpenTSDB, KairosDB, TimescaleDB
效果: 能测量性能和系统资源消耗
Ch. 1 Introduction
背景:为了处理物联网所产生的大数据,IT managers需要一款工具来choose the most appropriate database service that suits the business needs.
作者认为目前没有一款广受认可的基准。
已有的:
1. TPCx-IoT:功能:比较IoT gateways的不同软硬件解决方案。 缺点:无法处理 无序数据提取(out-of-order data ingestion), aggregation和down-sampling querying
2. YCSB-TS和InfluxDB-comparision: 无法处理out-of-order data ingestion, 不规则频率的时间序列,不支持多种数据分布
本文: https://github.com/thulab/iotdb-benchmark
特点:
考虑到以下三点
A. 要考虑不同数据分布 因为1. 不同编码在不同数据分布上效果显著不同 2. 不同类型的应用程序的效果明显不同
B. 不按照时间顺序的数据提取和按照时间的批量提取是两种非常常见且应该着重强调的操作
C. 基准测试需要自动收集系统指标
组成:
1. 能够模拟多种数据分布的data generator, e.g: sq wave, sine wave, sawtooth wave + 高斯噪声
2. data generator能生成有序/无序批量数据
3. data generator能生成混合操作-ingestion + query
4. 能监视系统资源消耗
5. 提供了API来操作结果数据
Ch. 2 Scenarios
本文面向工业化传感器网络。工业中,传感器数量很大,
可能产生的信号包括:周期性的有毛刺的数据,可能传送on-off类型的数据,或者不规则数据。
产生数据的频率可能是固定的,高频率或者有多种模式或者不固定模式的。
产生的数据一般会集合在一起成为packet再一起发送给数据中心,而数据中心也会接收到了之后将若干packets结合在一起为batch之后再insert。
数据一般是相对无序的,因为网络有延迟。
用户查询操作既包含:查一段时间,查平均值等aggregate function,查特定数据,查一定Value range的数据,不同的time granularity
Ch. 3 Benchmark Workloads
3.1 Data Ingestion
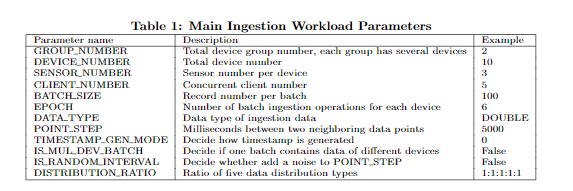
用户能够定义:
1) The schema of time series: 文中将time series划分为device group, device和sensor三种层次,用户可以定义每个层次有多少个,包含多少个子元素
2) 数据分布:
3.2 Query
Q1{Exact point query, i.e., select v1... from data where time=? and device in ?.
Q2{Time range query, i.e., select v1... from data where time > ? and time < ? and device in ?.
Q3{Query with limit and without lters, i.e., select v1... from data limit ?.
Q4{Time range query with value lter, i.e., select v1... from data where time > ? and time < ? and v1 op ? and device in ?.
Q5{Q4 with clause limit ?.
Q6{Aggregation query with time lter, i.e., select func(v1)... from data where device in ? and time > ? and time < ?.
Q7{Aggregation query with value lter, i.e., select func(v1)... from data where device in ? and value op ?, where op represents >, < or =.
Q8{Aggregation query with value lter and time lter, which is the combination of Q6 and Q7.
Q9{Latest point query, i.e., select time, v1... where device = ? and time = max(time).
Q10{Group by time range query.
Ch. 4 Performance Metric
cost-time, latency(TTLB, Time to Last Byte, 发送请求开始到完整接收回答所用的事件),average cost-time,throughput,used disk space(ingestion测试时尤其需要,与Write Ahead Log有关),system resource metrics(包括system CPU, memory usage, disk I/O usage)
Ch. 5 Benchmark Tool
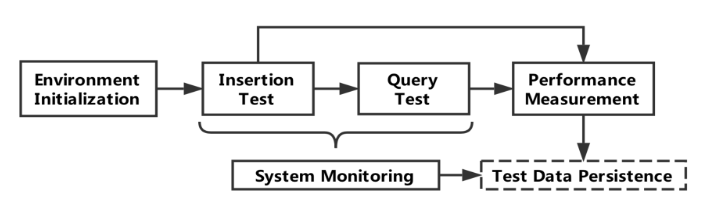
5.1 The Process
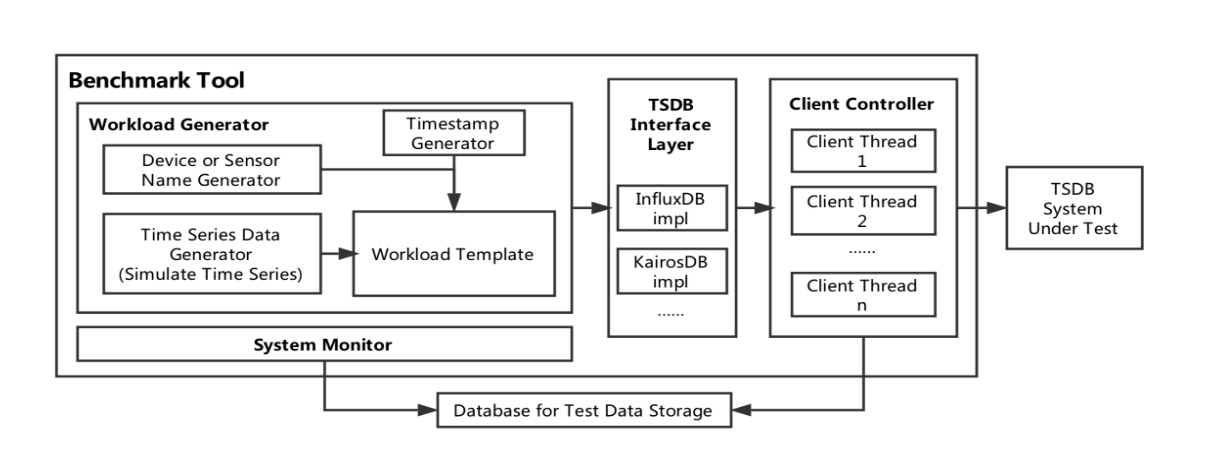
5.2 The architecture
Env init: 启动目标TSDB服务,删除旧数据,创建data schema
Ingestion test:
Query test:
Performance measurement:
System monitoring:用户能够控制测量频率
Test data persistence: ‘
模块图如下:
5.4 Query Test
By default, query test is based on the data generated by ingestion test.