示例代码:
data <- mtcars[1:10, ]
hc  <- hclust(dist(data))
hcd <- as.dendrogram(hc)

par(mfrow = c(1, 2))

par(mar = c(1,1 , 1, 0))
plot(hcd, horiz = T, yaxs = "i", axes = F, leaflab = "none")

sep <- 5 * max(strwidth(rownames(data), units = "inches")) + 1.2
par(mar = c(1, sep , 1, 1), adj = 0.5, mgp = c(3, sep / 2, 0), las = 1)
b <- barplot(1:10,  horiz = T, ylim = c(0.1, 10.1), yaxs = "i", width = 0.8, space = 0.25, xaxt = "n", border = NA)
axis(side = 2, at = b, rownames(data), line = NA, tcl = FALSE, lwd = 0, hadj = 0.5, padj = 0.5)
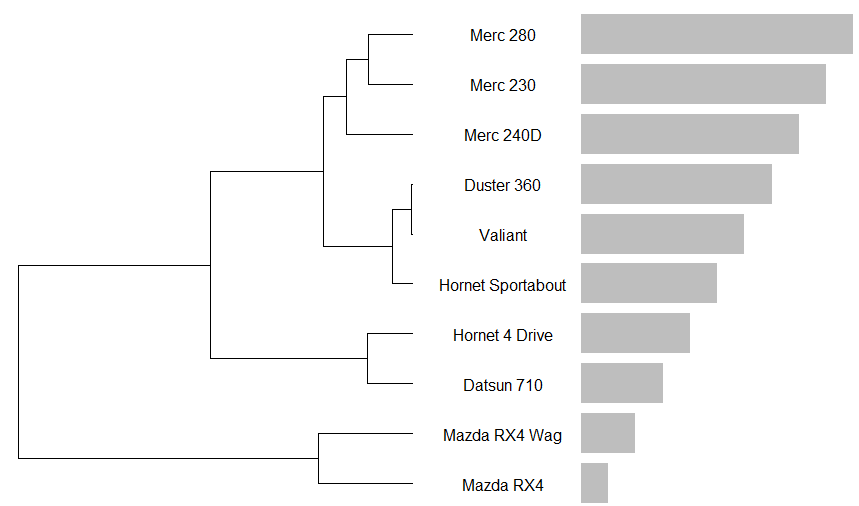
效果图如下: