1. Unexpected interrupt
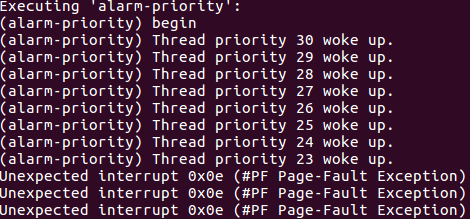
全局查“Unexpected interrupt”发现是 interrupt.c中的unexpected_interrupt打印的错误。根据注释“用中断帧f处理一个意外中断。一个意外中断是一个没有注册处理程序的中断。”
 1 /* Handles an unexpected interrupt with interrupt frame F.  An unexpected interrupt is one that has no registered handler. */
 3 static void
 4 unexpected_interrupt (const struct intr_frame *f)
 5 {
 6   /* Count the number so far. */
 7   unsigned int n = ++unexpected_cnt[f->vec_no];
 8
 9   /* If the number is a power of 2, print a message.  This rate
10      limiting means that we get information about an uncommon
11      unexpected interrupt the first time and fairly often after
12      that, but one that occurs many times will not overwhelm the
13      console. */
14   if ((n & (n - 1)) == 0)
15     printf ("Unexpected interrupt %#04x (%s)\n",
16     f->vec_no, intr_names[f->vec_no]);
17 }
另外,这里学到个用法: (n-1) 把n的最低位的1置0,于是n&(n-1)==0说明n只有最高位为1,即n是2的幂。
继续搜vec_no=e对应的Page-Fault是页错误,网上搜页错误发现大概意思是访问了非法内存。猜测是用指针的时候没写malloc。
2. OMG终于学会gdb怎么整了。
https://www.youtube.com/watch?v=0zO-8EwecP0
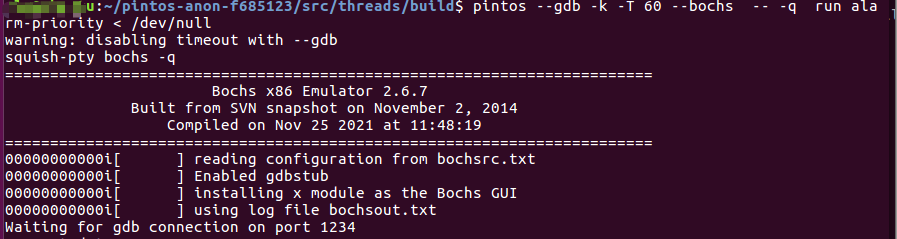
步骤:1. Terminal A中:/src/threads/下make ,然后 cd build ,然后 pintos --gdb -k -T 60 --bochs -- -q run alarm-priority < /dev/null (从make check 执行所有测试的命令的输出中截取单个测试的命令,在pintos后面加上“--gdb”) 应该显示如下:
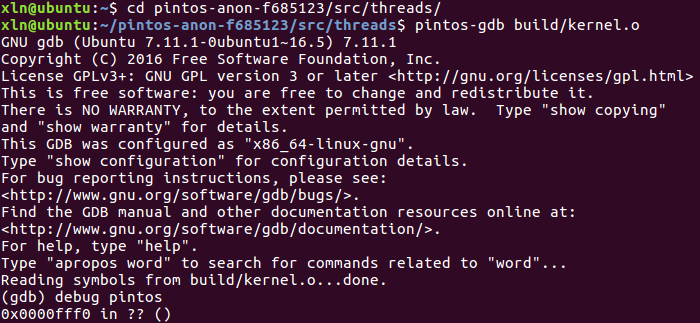
2. 另开个Terminal B,/src/threads/ 下 pintos-gdb build/kernel.o ,然后 debug pintos,然后A中会增加一行“Connected to 127.0.0.1”,B中应该显示如下:
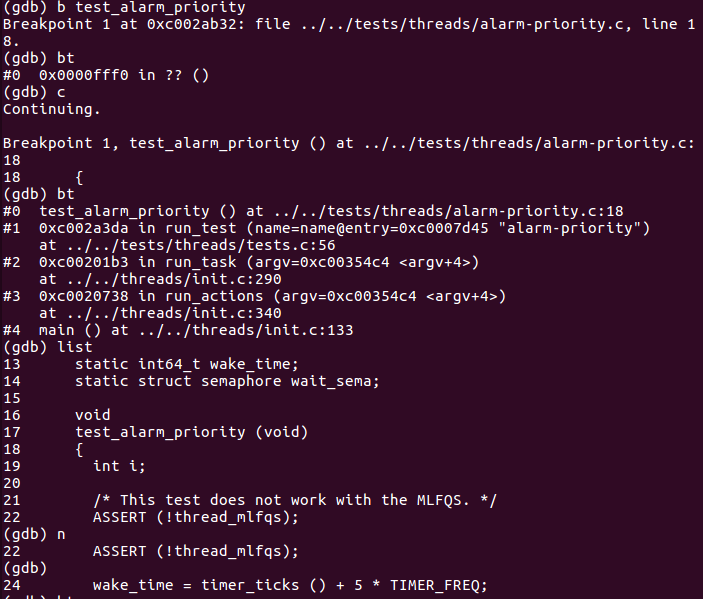
3. 然后打断点:b xxx(函数名);回溯:bt;下一步:c;下一行:n(好像 n 的步子小点);查看代码:list。
写出来发现是个贼简单的操作,但是不会的时候就是怎么都整不会,各种报错也google不到正解,太难受了。
3. 单个测试点测试
1. threads/ 下make
2. 进build 运行pintos -k -T 60 --bochs -- -q run alarm-single
alarm-single是测试文件的名字
4. 有效debug
1. dumplist &all_list thread allelem