1、Kibana介绍
Kibana是一个开源的分析和可视化平台,设计用于和Elasticsearch一起工作。
你用Kibana来搜索,查看,并和存储在Elasticsearch索引中的数据进行交互。
你可以轻松地执行高级数据分析,并且以各种图标、表格和地图的形式可视化数据。
Kibana使得理解大量数据变得很容易。
它简单的、基于浏览器的界面使你能够快速创建和共享动态仪表板,实时显示Elasticsearch查询的变化。
2、安装Kibana
下载地址:
https://www.elastic.co/cn/downloads/kibana
启动:
解压 bin/kibana
3、配置
https://www.elastic.co/guide/en/kibana/current/settings.html
基本配置以下三项,详细改动
vi /opt/app/kibana-7.4.2-linux-x86_64/config/kibana.yml
# Kibana is served by a back end server. This setting specifies the port to use.
server.port: 5601

# Specifies the address to which the Kibana server will bind. IP addresses and host names are both valid values.
# The default is 'localhost', which usually means remote machines will not be able to connect.
# To allow connections from remote users, set this parameter to a non-loopback address.
server.host: "192.168.8.101"

# The URLs of the Elasticsearch instances to use for all your queries.
elasticsearch.hosts: ["http://192.168.8.101:9200"]
4、查看和配置kibana
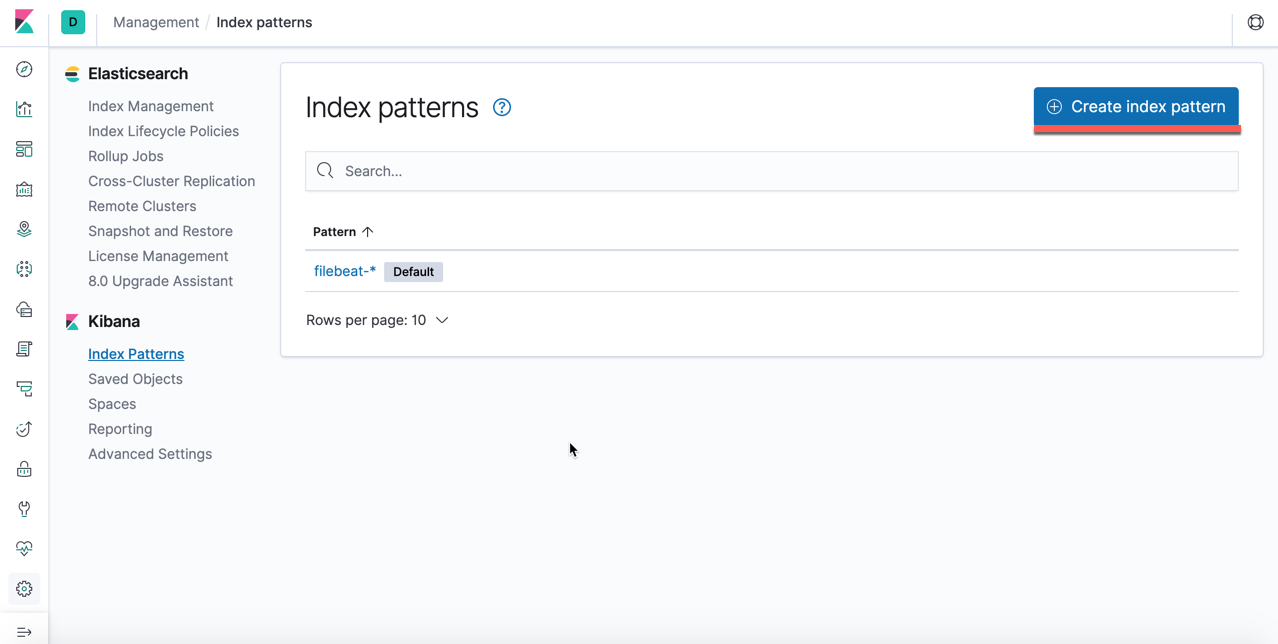
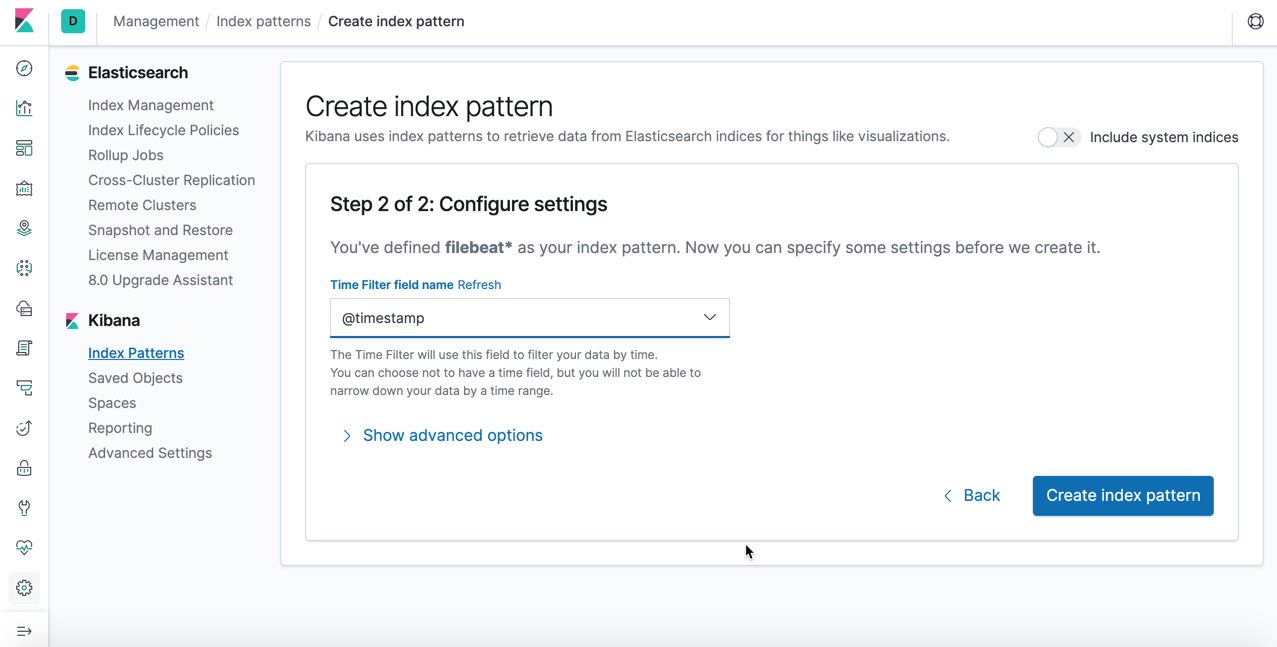
Management->Kibana->Index Patterns
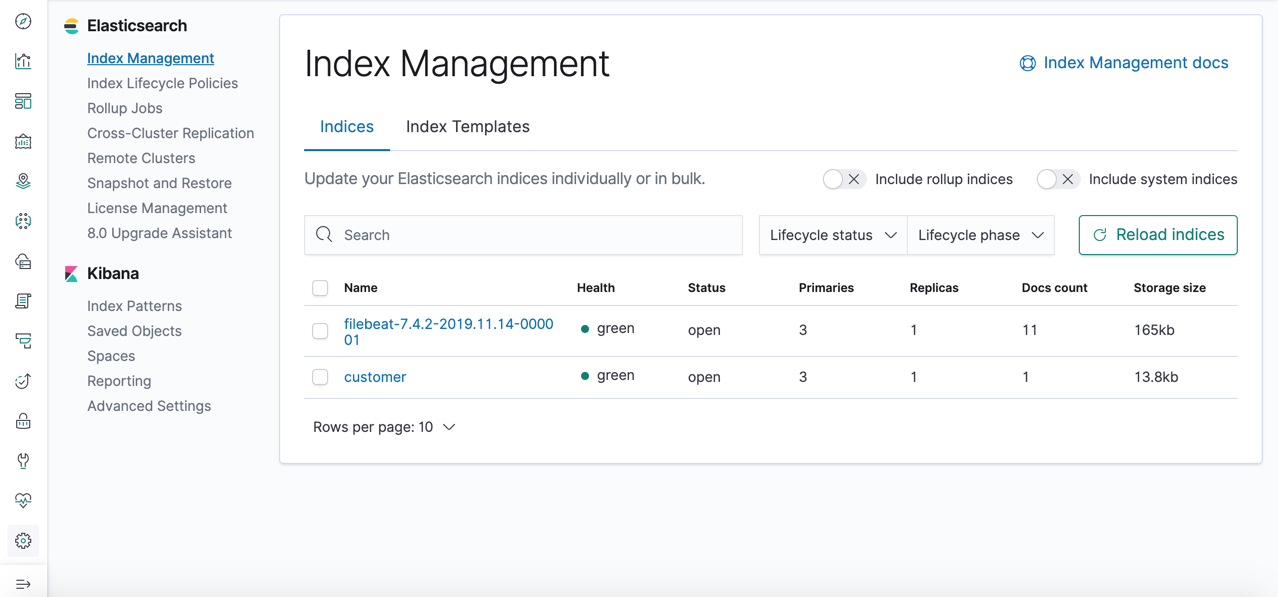
Management->ElasticSearch->Index Management
Discover

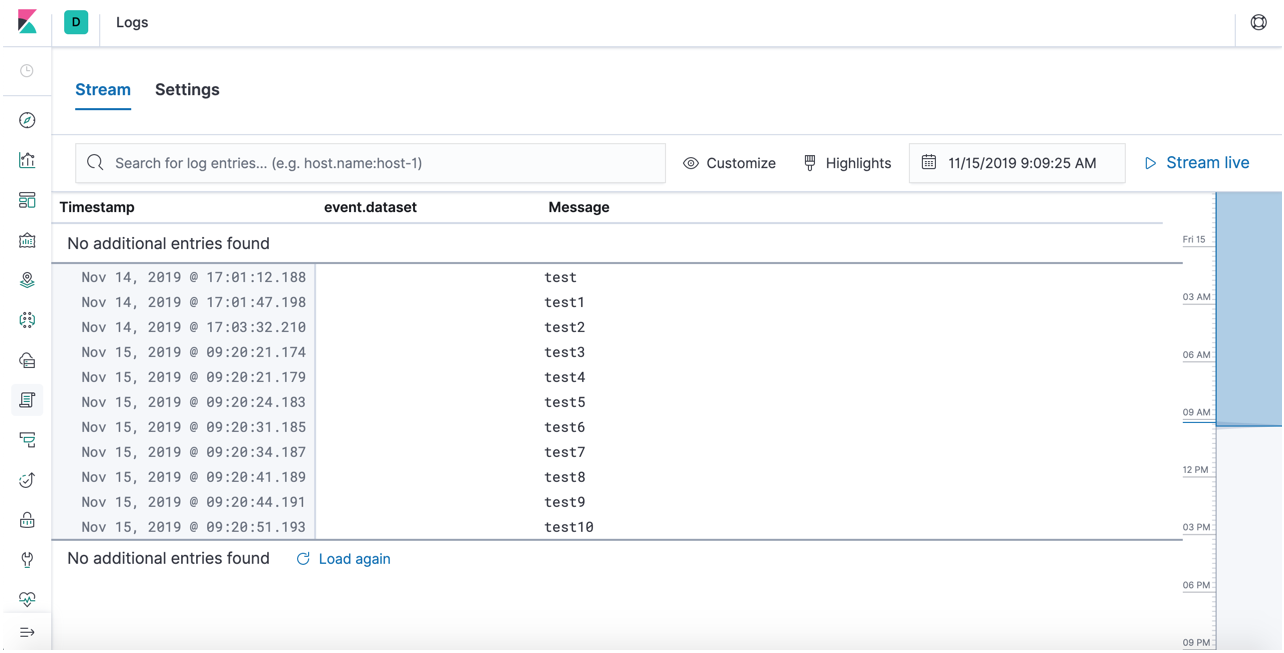
Logs