之前环境已经安装过相应环境,我们之间从插件开始安装
参考 :https://github.com/percona/mongodb_exporter
https://github.com/dcu/mongodb_exporter
https://github.com/Masterminds/glide/
使用的插件是:https://github.com/dcu/mongodb_exporter
使用的展示json是:https://grafana.com/dashboards/2583
需要先安装glide工具:参考地址https://studygolang.com/articles/10804
go get github.com/Masterminds/glide
go install github.com/Masterminds/glide
cd $GOPATH/src/github.com/Masterminds/glide
go build
cp glide /usr/local/bin
git clone https://github.com/dcu/mongodb_exporter.git $GOPATH/src/github.com/dcu/mongodb_exporter
cd $GOPATH/src/github.com/dcu/mongodb_exporter
make build
成功后,出现这个命令

用法可以用help查询
[root@localhost tmp]# mongodb_exporter --help
Usage of mongodb_exporter:
-alsologtostderr
log to standard error as well as files
-auth.pass string
Password for basic auth.
-auth.user string
Username for basic auth.
-groups.enabled string
Comma-separated list of groups to use, for more info see: docs.mongodb.org/manual/reference/command/serverStatus/ (default "asserts,durability,background_flushing,connections,extra_info,global_lock,index_counters,network,op_counters,op_counters_repl,memory,locks,metrics")
-log_backtrace_at value
when logging hits line file:N, emit a stack trace
-log_dir string
If non-empty, write log files in this directory
-logtostderr
log to standard error instead of files
-mongodb.collect.database
collect MongoDB database metrics
-mongodb.collect.oplog
collect Mongodb Oplog status (default true)
-mongodb.collect.replset
collect Mongodb replica set status (default true)
-mongodb.tls-ca string
Path to PEM file that conains the CAs that are trused for server connections.
If provided: MongoDB servers connecting to should present a certificate signed by one of this CAs.
If not provided: System default CAs are used.
-mongodb.tls-cert string
Path to PEM file that conains the certificate (and optionally also the private key in PEM format).
This should include the whole certificate chain.
If provided: The connection will be opened via TLS to the MongoDB server.
-mongodb.tls-disable-hostname-validation
Do hostname validation for server connection.
-mongodb.tls-private-key string
Path to PEM file that conains the private key (if not contained in mongodb.tls-cert file).
-mongodb.uri string
Mongodb URI, format: [mongodb://][user:pass@]host1[:port1][,host2[:port2],...][/database][?options] (default "mongodb://localhost:27017")
-stderrthreshold value
logs at or above this threshold go to stderr
-v value
log level for V logs
-version
Print mongodb_exporter version
-vmodule value
comma-separated list of pattern=N settings for file-filtered logging
-web.listen-address string
Address on which to expose metrics and web interface. (default ":9001")
-web.metrics-path string
Path under which to expose metrics. (default "/metrics")
-web.tls-cert string
Path to PEM file that conains the certificate (and optionally also the private key in PEM format).
This should include the whole certificate chain.
If provided: The web socket will be a HTTPS socket.
If not provided: Only HTTP.
-web.tls-client-ca string
Path to PEM file that conains the CAs that are trused for client connections.
If provided: Connecting clients should present a certificate signed by one of this CAs.
If not provided: Every client will be accepted.
-web.tls-private-key string
Path to PEM file that conains the private key (if not contained in web.tls-cert file).
现在将这个命令cp mongodb_exporter /usr/local/bin/ 然后可以直接使用了
由于我的mongdb是分片集群,需要密码,所以使用url的登录方式
举例如下:mongodb_exporter -mongodb.uri mongodb://test:123456@192.168.33.131:27017
到此,mongodb_exporter部署完成了,现在开始修改peometheus的配置文件
[root@localhost prometheus]# cat prometheus.yml
# my global config
global:
scrape_interval: 15s # Set the scrape interval to every 15 seconds. Default is every 1 minute.
evaluation_interval: 15s # Evaluate rules every 15 seconds. The default is every 1 minute.
# scrape_timeout is set to the global default (10s).
# Alertmanager configuration
alerting:
alertmanagers:
- static_configs:
- targets:
# - alertmanager:9093
# Load rules once and periodically evaluate them according to the global 'evaluation_interval'.
rule_files:
# - "first_rules.yml"
# - "second_rules.yml"
# A scrape configuration containing exactly one endpoint to scrape:
# Here it's Prometheus itself.
scrape_configs:
# The job name is added as a label `job=<job_name>` to any timeseries scraped from this config.
- job_name: 'prometheus'
# metrics_path defaults to '/metrics'
# scheme defaults to 'http'.
scrape_interval: 5s
static_configs:
- targets: ['192.168.33.134:9090']
labels:
instance: prometheus
- job_name: 'centos7-machine1'
scrape_interval: 10s
static_configs:
- targets: ['192.168.33.131:9100']
labels:
instance: 192.168.33.131
- job_name: 'centos7-machine2'
scrape_interval: 10s
static_configs:
- targets: ['192.168.33.132:9100']
labels:
instance: 192.168.33.132
- job_name: 'centos7-machine3'
scrape_interval: 10s
static_configs:
- targets: ['192.168.33.132:9100']
labels:
instance: 192.168.33.133
- job_name: 'centos7-machine4'
scrape_interval: 10s
static_configs:
- targets: ['192.168.33.134:9100']
labels:
instance: 192.168.33.134
- job_name: 'win2012-machine5'
scrape_interval: 10s
static_configs:
- targets: ['192.168.33.135:9182']
labels:
instance: 192.168.33.135
- job_name: 'redis'
scrape_interval: 10s
static_configs:
- targets: ['192.168.33.131:9121','192.168.33.132:9121','192.168.33.133:9121']
labels:
group: 'redis-group'
- job_name: 'mongodb-1'
scrape_interval: 10s
static_configs:
- targets: ['192.168.33.131:9001']
labels:
group: 'mongodb-group'
- job_name: 'mongodb-2'
scrape_interval: 10s
static_configs:
- targets: ['192.168.33.132:9001']
labels:
group: 'mongodb-group'
- job_name: 'mongodb-3'
scrape_interval: 10s
static_configs:
- targets: ['192.168.33.133:9001']
labels:
group: 'mongodb-group'
此时重启prometheus服务即可
然后启动mongodb_exporter服务:mongodb_exporter -mongodb.uri mongodb://test:123456@192.168.33.131:27017
或者加入后台启动mongodb_exporter -mongodb.uri mongodb://test:123456@192.168.33.131:27017 >/dev/null 2>&1 &
所有需要监控的mongo服务器都需要部署mongodb_exporter
如果出现没有http://$ip:9001/metrics的监控指标很少的话,请自行看一下后台,一定是权限哪里出了问题,有可能是没有权限读取配置文件
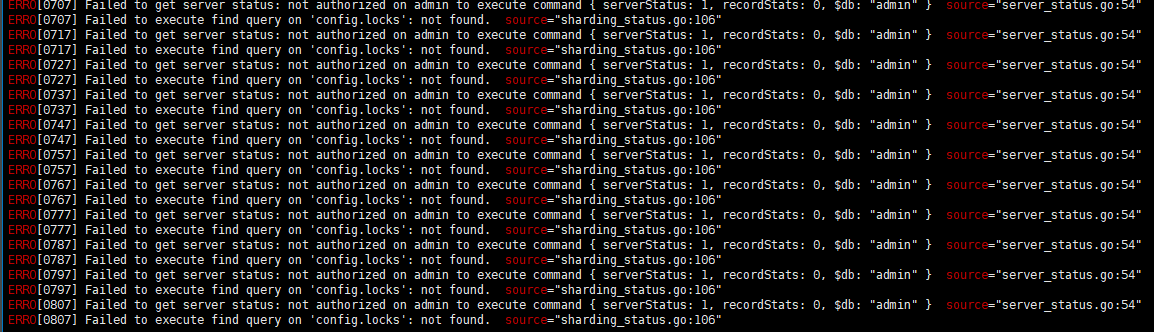
这个后台日志说明没有权限,加上就好了
这个监控插件需要使用系统用户
use admin
db.createUser(
{
user: "test",
pwd: "123456",
roles: [ { role: "__system", db: "admin" } ]
}
)
或者你直接增加你的用户权限
db.grantRolesToUser("test", [{role:"__system", db:"admin"}])
启动脚本(之前已经将mongodb_exporter命令cp到了/usr/local/bin下)
[root@rocketmq-master2 init.d]# cat /etc/init.d/mongodb_exporter
#!/bin/bash
IP=`ip addr | grep -v virbr |grep -o -e 'inet [0-9]{1,3}.[0-9]{1,3}.[0-9]{1,3}.[0-9]{1,3}'|grep -v "127.0.0"|awk '{print $2}'`
PORT=27017
COMMAND=/usr/local/bin/mongodb_exporter
SERVER=mongodb_exporter
USER=txkj
PASSWORD=123456
PIDNUM=`pidof $SERVER`
start(){
if [ -z "$PIDNUM" ];then
$COMMAND -mongodb.uri mongodb://$USER:$PASSWORD@$IP:$PORT >/dev/null 2>&1 &
echo "Now,the server has runing"
else
echo "$0 is running"
fi
}
stop(){
if [ -z "$PIDNUM" ];then
echo "$0 is not running"
else
echo "shutting down $0"
kill -9 "$PIDNUM" && echo "PID $PIDNUM was killed."
fi
}
status(){
if [[ -z "$PIDNUM" ]];then
echo "$0 is not runing"
else
echo "$0 is runing,it's PID is $PIDNUM"
fi
}
case $1 in
start)
start
;;
stop)
stop
;;
status)
status
;;
restart)
stop
start
;;
*)
echo "Usage:$0 {start|stop|status|restart}"
;;
esac
然后给执行权限
于是可以用/etc/init.d/mongodb_export start 或者使用 service mongodb_exporter start 来启动了
转载:https://www.cnblogs.com/fatyao/p/11192210.html