探索酒类消费数据
相关数据见(github)
步骤1 - 导入pandas库
import pandas as pd
步骤2 - 数据集
path3 = "./data/drinks.csv" # drinks.csv
步骤3 将数据框命名为drinks
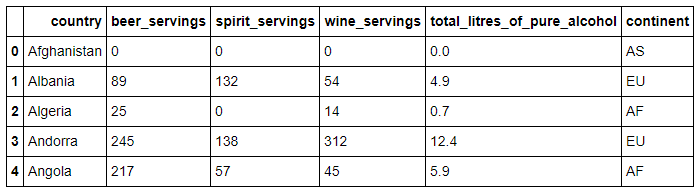
drinks = pd.read_csv(path3)
drinks.head()
输出:
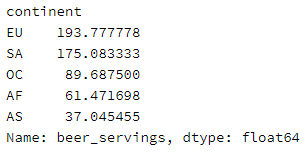
步骤4 哪个大陆(continent)平均消耗的啤酒(beer)更多?
beeravg = drinks.groupby('continent').beer_servings.mean()
beeravg.sort_values(ascending=False)
输出:
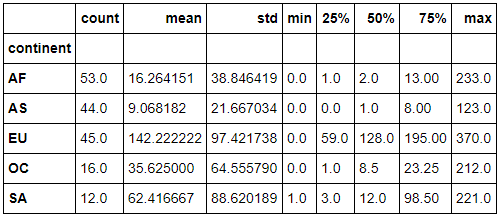
步骤5 打印出每个大陆(continent)的红酒消耗(wine_servings)的描述性统计值
drinks.groupby('continent').wine_servings.describe()
输出:
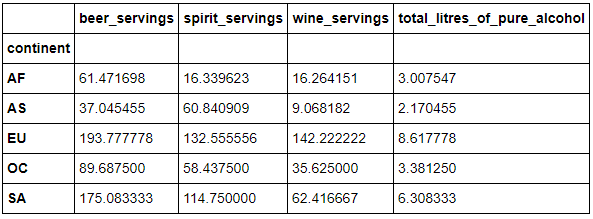
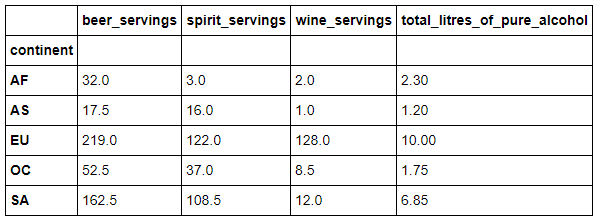
步骤6 打印出每个大陆每种酒类别的消耗平均值
drinks.groupby('continent').mean()
输出:
步骤7 打印出每个大陆每种酒类别的消耗中位数
drinks.groupby('continent').median()
输出:
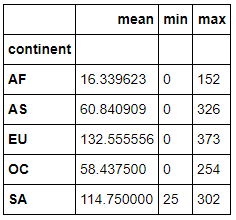
步骤8 打印出每个大陆对spirit饮品消耗的平均值,最大值和最小值
drinks.groupby('continent').spirit_servings.agg(['mean', 'min', 'max'])
输出:
参考链接:
1、http://pandas.pydata.org/pandas-docs/stable/cookbook.html#cookbook
2、https://www.analyticsvidhya.com/blog/2016/01/12-pandas-techniques-python-data-manipulation/