以下内容为学习下图这本书做的笔记,非原创。做笔记主要是为了实践一下看看结果加深记忆。
目录:
1. 颜色 2. 不透明度 3. 实线 4. 虚线 5. 线性渐变 6. 径向渐变 7. 图案 8. 阴影 9. 填充规则
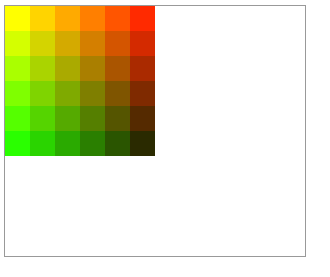
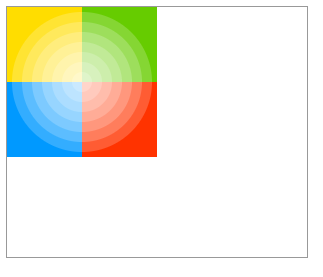
① 使用嵌套 for 循环绘制方格阵列,每个方格填充不同色。通过渐变的频率,可以绘制出类似 Photoshop 调色板的效果。
语句:
 1 <canvas id="canvas" width="300" height="250" style="border:solid 1px #999;"></canvas>
 2 <script>
 3 draw();
 4 function draw(){
 5     //使用document.getElementById() 方法, 根据 canvas 元素的 id 获取对 canvas 的引用
 6     var ctx = document.getElementById('canvas').getContext('2d');
 7     for( var i=0; i<6; i++ ){
 8         for( var j=0; j<6; j++ ){
 9             //fillStyle 设置图形的填充颜色
10             ctx.fillStyle = 'rgb('+Math.floor(255-42.5*i)+','+Math.floor(255-42.5*j)+',0)'; //这里只改变红色绿色通道的值,蓝色通道的值不变
11             ctx.fillRect( j*25, i*25, 25, 25 );
12         }
13     }
14 }
15 </script>
页面表现:
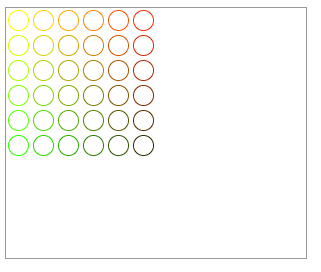
② 使用 strokeStyle 属性,用 arc()画圆,绘制渐变圆圈。
语句:
 1 <canvas id="canvas" width="300" height="250" style="border:solid 1px #999;"></canvas>
 2 <script>
 3 draw();
 4 function draw(){
 5     //使用document.getElementById() 方法, 根据 canvas 元素的 id 获取对 canvas 的引用
 6     var ctx = document.getElementById('canvas').getContext('2d');
 7     for( var i=0; i<6; i++ ){
 8         for( var j=0; j<6; j++ ){
 9             //stokeStroke 设置图形轮廓的颜色
10             ctx.strokeStyle = 'rgb('+Math.floor(255-42.5*i)+','+Math.floor(255-42.5*j)+',0)'; //这里只改变红色绿色通道的值,蓝色通道的值不变
11             ctx.beginPath();
12             ctx.arc(12.5+j*25,12.5+i*25,10,0,Math.PI*2,true);
13             ctx.stroke();
14         }
15     }
16 }
17 </script>
页面表现:
① 使用四色格做背景,设置 globalAlpha 为0.2后,在上面画一系列半径递增的半透明圆,最终结果是一个径向渐变效果。原叠加得更多,原先所画的圆的透明度会更低。通过增加循环次数,画更多的圆,背景图的中心部分会完全消失。
语句:
 1 <canvas id="canvas" width="300" height="250" style="border:solid 1px #999;"></canvas>
 2 <script>
 3 draw();
 4 function draw(){
 5     //使用document.getElementById() 方法, 根据 canvas 元素的 id 获取对 canvas 的引用
 6     var ctx = document.getElementById('canvas').getContext('2d');
 7     //画背景
 8     ctx.fillStyle = '#FD0'; //给图形上色
 9     ctx.fillRect(0,0,75,75);    //画矩形
10     ctx.fillStyle = '#6C0';
11     ctx.fillRect(75,0,75,75);
12     ctx.fillStyle = '#09F';
13     ctx.fillRect(0,75,75,75);
14     ctx.fillStyle = '#F30';
15     ctx.fillRect(75,75,75,75);
16     ctx.fillStyle = '#FFF';
17     //设置透明度值
18     ctx.globalAlpha = 0.2;
19     //画半透明圈
20     for( var i=0; i<7; i++ ){
21         ctx.beginPath();
22         ctx.arc(75,75,10+10*i,0,Math.PI*2,true);
23         ctx.fill();
24     }
25 }
26 </script>
页面表现:
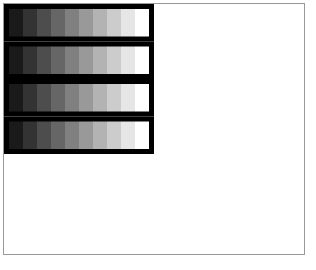
② 用 rgba() 方法设置不透明度
语句:
 1 <canvas id="canvas" width="300" height="250" style="border:solid 1px #999;"></canvas>
 2 <script>
 3 draw();
 4 function draw(){
 5     //使用document.getElementById() 方法, 根据 canvas 元素的 id 获取对 canvas 的引用
 6     var ctx = document.getElementById('canvas').getContext('2d');
 7     //画背景
 8     ctx.fillStyle = 'rbg(225,221,0)'; //给图形上色
 9     ctx.fillRect(0,0,150,37.5);    //画矩形
10     ctx.fillStyle = 'rbg(102,204,0)';
11     ctx.fillRect(0,37.5,150,37.5);
12     ctx.fillStyle = 'rbg(0,153,255)';
13     ctx.fillRect(0,75,150,37.5);
14     ctx.fillStyle = 'rbg(255,51,0)';
15     ctx.fillRect(0,112.5,150,37.5);
16     //画半透明矩形
17     for( var i=0; i<10; i++ ){
18         ctx.fillStyle = 'rgba(255,255,255,'+(i+1)/10+')';
19         for( var j=0; j<4; j++ ){
20             ctx.fillRect(5+i*14, 5+j*37.5, 14, 27.5);
21         }
22     }
23 }
24 </script>
页面表现:
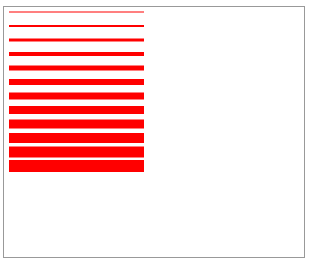
① 使用 for 循环绘制了12条线宽依次递增的线段
语句:
 1 <canvas id="canvas" width="300" height="250" style="border:solid 1px #999;"></canvas>
 2 <script>
 3 draw();
 4 function draw(){
 5     //使用document.getElementById() 方法, 根据 canvas 元素的 id 获取对 canvas 的引用
 6     var ctx = document.getElementById('canvas').getContext('2d');
 7     for( var i=0; i<12; i++ ){
 8         ctx.strokeStyle="red";
 9         ctx.lineWidth = 1 + i;      //使用lineWidth可以设置线条的粗细,取值必须为正数,默认为1.0
10         ctx.beginPath();
11         ctx.moveTo(5, 5+i*14);
12         ctx.lineTo(140, 5+i*14);    //lineTo(x,y)绘制直线,x、y分别为终点的横坐标、纵坐标
13         ctx.stroke();               //描边路径。通过线条来绘制图形轮廓
14     }
15 }
16 </script>
页面表现:
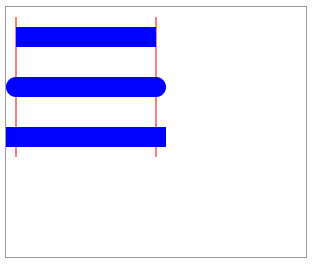
② 绘制三条蓝色的直线段,并依次设置三种属性值 butt、round 跟 square ,两侧有两条红色的参考线,以方便观察
语句:
 1 <canvas id="canvas" width="300" height="250" style="border:solid 1px #999;"></canvas>
 2 <script>
 3 draw();
 4 function draw(){
 5     //使用document.getElementById() 方法, 根据 canvas 元素的 id 获取对 canvas 的引用
 6     var ctx = document.getElementById('canvas').getContext('2d');
 7     var lineCap = ['butt','round','square'];  //butt、round、square的端点依次为平头、圆头、方头
 8     //绘制参考线
 9     ctx.strokeStyle = 'red';
10     ctx.beginPath;
11     ctx.moveTo(10,10);
12     ctx.lineTo(10,150);
13     ctx.moveTo(150,10);
14     ctx.lineTo(150,150);
15     ctx.stroke();
16     //绘制直线段
17     ctx.strokeStyle = 'blue';
18     for( var i=0; i<lineCap.length; i++ ){
19         ctx.lineWidth = 20; //设置线条的粗细
20         ctx.lineCap = lineCap[i];
21         ctx.beginPath();
22         ctx.moveTo(10,30+i*50);
23         ctx.lineTo(150,30+i*50);
24         ctx.stroke();
25     }
26 }
27 </script>
页面表现:
③ 绘制三条蓝色的折现,并依次设置上述三种属性值,观察拐角处样式的区别。
语句:
 1 <canvas id="canvas" width="300" height="250" style="border:solid 1px #999;"></canvas>
 2 <script>
 3 draw();
 4 function draw(){
 5     //使用document.getElementById() 方法, 根据 canvas 元素的 id 获取对 canvas 的引用
 6     var ctx = document.getElementById('canvas').getContext('2d');
 7     var lineJoin = ['round','bevel','miter'];
 8     ctx.strokeStyle = 'blue';
 9     for( var i=0; i<lineJoin.length; i++ ){
10         ctx.lineWidth = 25;
11         ctx.lineJoin = lineJoin[i];
12         ctx.beginPath();
13         ctx.moveTo(10+i*150,30);
14         ctx.lineTo(100+i*150,30);
15         ctx.lineTo(100+i*150,100);
16         ctx.stroke();
17     }
18 }
19 </script>
页面表现:

④ 观察当角度和 miterLimit 属性值发生变化时斜面长度的变化。在运行代码之前,也可以将 miterLimit 属性值改为固定值,以观察不同的值产生的结果。
miterLimit属性用于规定两条线段交点处的绘制方式,作用是为斜面的长度设置一个上限,默认为 10 ,即规定斜面的长度不能超过线条宽度的10倍。当斜面的长度达到线条宽度的10倍时,就会变成斜角。
语句:
 1 <canvas id="canvas" width="300" height="400" style="border:solid 1px #999;"></canvas>
 2 <script>
 3 draw();
 4 function draw(){
 5     //使用document.getElementById() 方法, 根据 canvas 元素的 id 获取对 canvas 的引用
 6     var ctx = document.getElementById('canvas').getContext('2d');
 7     for( var i=1; i<10; i++ ){
 8         ctx.strokeStyle = 'blue';
 9         ctx.lineWidth = 10;
10         ctx.lineJoin = 'miter';
11         ctx.miterLimit = i*10;
12         ctx.beginPath();
13         ctx.moveTo(10, i*30);
14         ctx.lineTo(100, i*30);
15         ctx.lineTo(10, 33*i);
16         ctx.stroke();
17     }
18 }
19 </script>
页面表现:

① 绘制一个矩形虚线框,然后使用定时器设计每隔设计0.5秒重绘一次,重绘时改变 lineDashOffset 属性值,从而创建一个行军蚁的效果。
语句:
 1 <canvas id="canvas" width="300" height="250" style="border:solid 1px #999;"></canvas>
 2 <script>
 3 //使用document.getElementById() 方法, 根据 canvas 元素的 id 获取对 canvas 的引用
 4 var ctx = document.getElementById('canvas').getContext('2d');
 5 var offset = 0;
 6 function draw(){
 7     ctx.clearRect(0,0,canvas.width,canvas.height);
 8     ctx.setLineDash([4,4]);     //setLineDash()方法接收一个数组来指定线段与间隙的交替
 9     ctx.lineDashOffset = offset;   //lineDashOffset 属性设置起始偏移量
10     ctx.strokeRect(50,50,200,100);
11 }
12 function march(){
13     offset++;
14     if(offset>16){
15         offset = 0;
16     }
17     draw();
18     setTimeout(march, 100);
19 }
20 march();
21 </script>
页面表现:
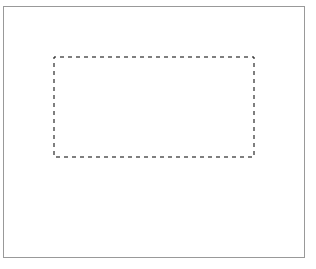
效果是虚线在动,像行军蚁一样。
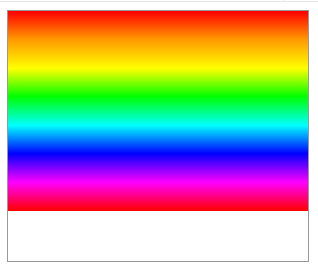
① 绘制线性渐变。添加8个色标,分别为红、橙、黄、路、青、蓝、紫、红。
用法:context . createLinearGradient(x0, y0,x1, y1) ,参数说明:
x0: 渐变开始点的 x 坐标 y0: 渐变开始点的 y 坐标
x1: 渐变结束点的 x 坐标 y1: 渐变结束点的 y 坐标
语句:
 1 <canvas id="canvas" width="300" height="250" style="border:solid 1px #999;"></canvas>
 2 <script>
 3     draw();
 4     function draw(){
 5         //使用document.getElementById() 方法, 根据 canvas 元素的 id 获取对 canvas 的引用
 6         var ctx = document.getElementById('canvas').getContext('2d');
 7         //创建渐变
 8         var lingrad = ctx.createLinearGradient(0, 0, 0, 200);   //用createLinearGradient()创建 canvasGradient 对象
 9         lingrad.addColorStop(0, '#ff0000'); //使用 addColorStop() 上色
10         lingrad.addColorStop(1/7, '#ff9900');
11         lingrad.addColorStop(2/7, '#ffff00');
12         lingrad.addColorStop(3/7, '#00ff00');
13         lingrad.addColorStop(4/7, '#00ffff');
14         lingrad.addColorStop(5/7, '#0000ff');
15         lingrad.addColorStop(6/7, '#ff00ff');
16         lingrad.addColorStop(1, '#ff0000');
17         ctx.fillStyle = lingrad;
18         ctx.strokeStyle = lingrad;
19         ctx.fillRect(0, 0, 300, 200);
20     }
21 </script>
页面表现:
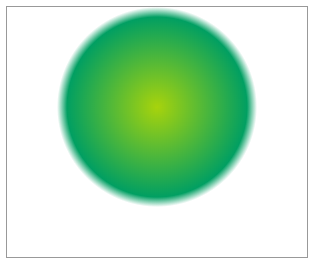
① 使用径向渐变在画布中央绘制一个圆球形状
用法:context . createRadialGradient(x0, y0, r0, x1, y1, r1) ,参数说明:
x0: 渐变的开始的圆的 x 坐标 y0: 渐变的开始的圆的 y 坐标
r0: 开始圆的半径 x1: 渐变的开始圆的 x 坐标
y1: 渐变的结束圆的 y 坐标 r1: 结束圆的半径
语句:
 1 <canvas id="canvas" width="300" height="250" style="border:solid 1px #999;"></canvas>
 2 <script>
 3     draw();
 4     function draw(){
 5         //使用document.getElementById() 方法, 根据 canvas 元素的 id 获取对 canvas 的引用
 6         var ctx = document.getElementById('canvas').getContext('2d');
 7         //创建渐变
 8         var radgrad = ctx.createRadialGradient(150,100,0,150,100,100);   //createRadialGradient() 创建canvasGradient对象
 9         radgrad.addColorStop(0,'#A7D30C');      //使用 addColorStop() 上色
10         radgrad.addColorStop(0.9,'#019F62');
11         radgrad.addColorStop(1,'rgba(1,159,98,0)');
12         //填充渐变色
13         ctx.fillStyle = radgrad;
14         ctx.fillRect(0,0,300,200);
15     }
16 </script>
页面表现:
用法:createPattern( image, "repeat|repeat-x|repeat-y|no-repeat" ),参数说明:
repeat : 在水平和垂直方向重复 repeat-x : 只在水平方向重复
repeat-y : 只在垂直方向重复 no-repeat : 只显示一次,不重复
① 以一幅 png 格式的图像作为 image 对象创建图案,以平铺方式同时沿 x 轴和 y 轴方向平铺
语句:
 1 <canvas id="canvas" width="300" height="250" style="border:solid 1px #999;"></canvas>
 2 <script>
 3     draw();
 4     function draw(){
 5         //使用document.getElementById() 方法, 根据 canvas 元素的 id 获取对 canvas 的引用
 6         var ctx = document.getElementById('canvas').getContext('2d');
 7         //创建用于图案的新 image 对象
 8         var img = new Image();
 9         img.src = 'aixin.png';
10         img.onload = function(){
11             //创建图案
12             var ptrn = ctx.createPattern(img, 'repeat');    //使用 createPattern() 绘制图案效果
13             ctx.fillStyle = ptrn;
14             ctx.fillRect(0,0,600,600);
15         }
16     }
17 </script>
页面表现:
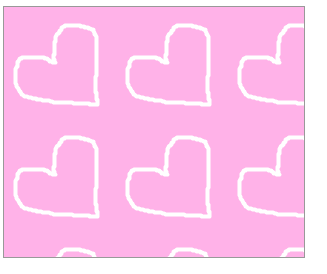
下图为 aixin.png:

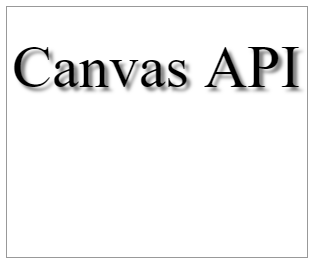
① 创建文字阴影效果
语句:
 1 <canvas id="canvas" width="300" height="250" style="border:solid 1px #999;"></canvas>
 2 <script>
 3     draw();
 4     function draw(){
 5         //使用document.getElementById() 方法, 根据 canvas 元素的 id 获取对 canvas 的引用
 6         var ctx = document.getElementById('canvas').getContext('2d');
 7         //设置阴影
 8         ctx.shadowOffsetX = 4;      //shadowOffsetX : 设置阴影在 x 轴的偏移距离
 9         ctx.shadowOffsetY = 4;      //shadowOffsetY : 设置阴影在 y 轴的偏移距离
10         ctx.shadowBlur = 4;         //shadowBlur : 设置阴影的模糊级别
11         ctx.shadowColor = "rgba(0,0,0,0.5)";    //shadowColor : 设置阴影颜色
12         //绘制文本
13         ctx.font = "60px Times New Roman";
14         ctx.fillStyle = "Black";
15         ctx.fillText("Canvas API",5,80);
16     }
17 </script>
页面表现:
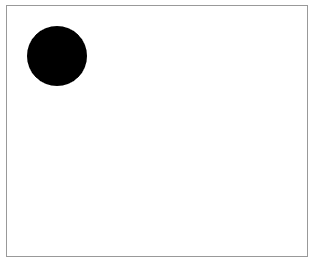
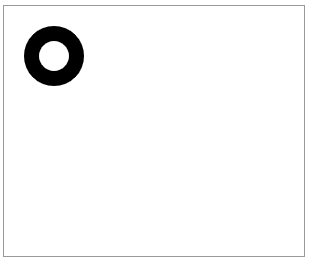
① 使用 enenodd 规则填充图形
语句:
 1 <canvas id="canvas" width="300" height="250" style="border:solid 1px #999;"></canvas>
 2 <script>
 3     draw();
 4     function draw(){
 5         //使用document.getElementById() 方法, 根据 canvas 元素的 id 获取对 canvas 的引用
 6         var ctx = document.getElementById('canvas').getContext('2d');
 7         ctx.beginPath();
 8         ctx.arc(50,50,30,0,Math.PI*2,true);
 9         ctx.arc(50,50,15,0,Math.PI*2,true);
10         ctx.fill("evenodd");    //evenodd :奇偶规则 nonzero : 非零环绕数规则,为默认值
11     }
12 </script>
页面表现:
② 使用 nonzero 规则填充图形
语句:
将上面的第 10 行改为 ctx.fill( "nonzero" );
页面表现: