highcharts 根据表格转化为不同的图表

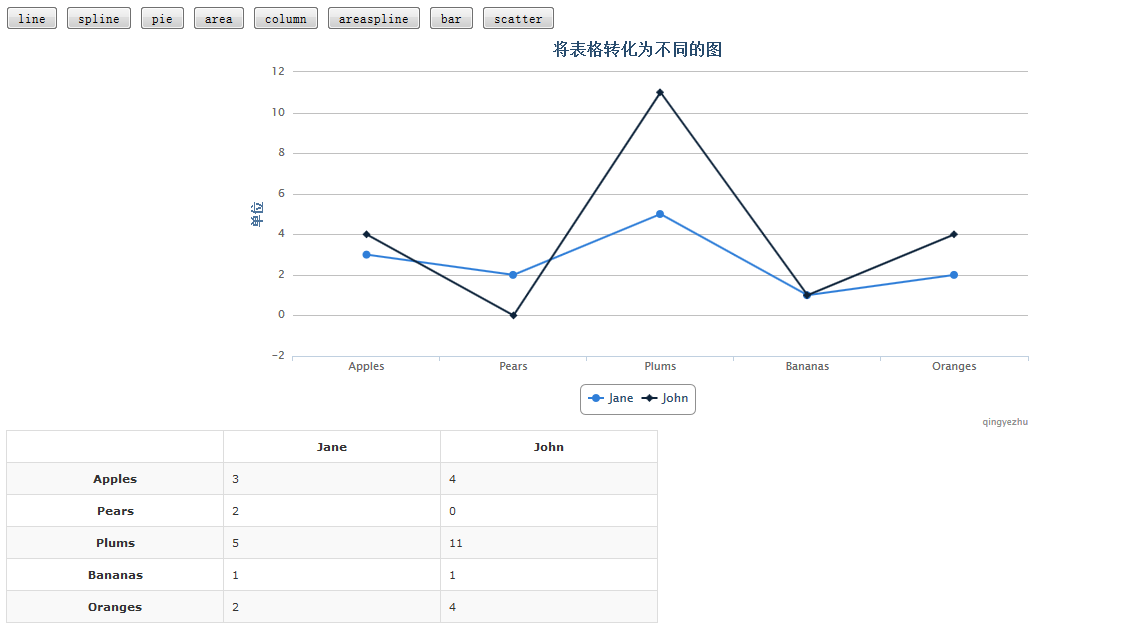
<!doctype html> 
<html lang="zh"> 
    <head> 
        <meta http-equiv="Content-Type" content="text/html;charset=utf-8"/>
        <script type="text/javascript" src="js/jquery-1.8.3.js"></script>
        <script type="text/javascript" src="js/highcharts.js"></script>
        <script type="text/javascript" src="js/modules/data.js"></script>
        <script type="text/javascript">
            
            $(document).ready(function(){
                changeChart('line');
                $("button.btnChart").click(function(){
                    var type = $(this).html();
                    changeChart(type);
                });
                $('.datatableClass tr:gt(0)').mouseover(function(){
                    $(this).addClass('over');
                }).mouseout(function(){
                    $(this).removeClass('over');
                });
                $('.datatableClass tr:gt(0):even').addClass('even');
                
                function changeChart(type){
                    $('#container').highcharts( {
                    data:{
                        table: document.getElementById('datatableId')
                    },
                    chart:{
                        type:type
                    },
                    plotOptions:{
                        pie:{
                            showInLegend:true
                        }
                    },
                    credits:{
                        enabled:true,
                        href:'http://www.cnblogs.com/xiaoxian1369/p/3777526.html',
                        text:'qingyezhu'
                    },
                    title:{
                        text:'<b>将表格转化为不同的图</b>'
                    },
                    yAxis:{
                        allowDecimals:false,
                        title:{
                            text:'单位'
                        }
                    },
                    tooltip:{
                        pointFormat:'{series.name}:<b>{point.y}</b>'
                    }
                });
                }
            });
            
            
        </script>
        <style type="text/css">
            table.datatableClass{
                border-width:1px;
                border-color:#dddddd;
                border-collapse:collapse;
                color:#333333;
                font-size:11px;
                font-family:verdana,arial,sans-serif,'微软雅黑';
            }
            
            table.datatableClass th,table.datatableClass td{
                border-width:1px;
                border-style:solid;
                border-color:#dddddd;
                padding:8px;
                width:200px;
            }
            
            tr.even{
                background:#F9F9F9;
            }
            
            tr.over{
                background:#F5F5F5;
            }
            
        </style>
    </head>
    <body> 
        <div>
            <button class="btnChart">line</button>
            <button class="btnChart">spline</button>
            <button class="btnChart">pie</button>
            <button class="btnChart">area</button>
            <button class="btnChart">column</button>
            <button class="btnChart">areaspline</button>
            <button class="btnChart">bar</button>
            <button class="btnChart">scatter</button>
        </div>
        <div id="container" style="800px;height:400px;margin:0 auto;"></div>
        <div>
            <table id="datatableId" class="datatableClass">
                <thead>
                    <tr>
                        <th></th>
                        <th>Jane</th>
                        <th>John</th>
                    </tr>
                </thead>
                <tbody>
                    <tr>
                        <th>Apples</th>
                        <td>3</td>
                        <td>4</td>
                    </tr>
                    <tr>
                        <th>Pears</th>
                        <td>2</td>
                        <td>0</td>
                    </tr>
                    <tr>
                        <th>Plums</th>
                        <td>5</td>
                        <td>11</td>
                    </tr>
                    <tr>
                        <th>Bananas</th>
                        <td>1</td>
                        <td>1</td>
                    </tr>
                    <tr>
                        <th>Oranges</th>
                        <td>2</td>
                        <td>4</td>
                    </tr>
                </tbody>
            </table>
        </div>
    </body>
</html>

原文地址:https://www.cnblogs.com/xiaoxian1369/p/3777526.html