-------tip1--------
在 tooltip 里边配置:拼接字符串;
tooltip : {
    trigger: 'axis',
    formatter:function(params)
    {
var relVal = params[0].name;
        for (var i = 0, l = params.length; i < l; i++) {
            i === 2 ? relVal += '<br/>' +params[i].marker+ params[i].seriesName  + params[i].value +"%" : relVal += '<br/>' +params[i].marker+ params[i].seriesName  + params[i].value;
        }
        return relVal;
    }
},
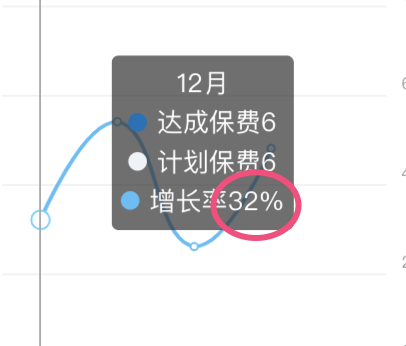
-------tip2-------- 2019-3-14 追加
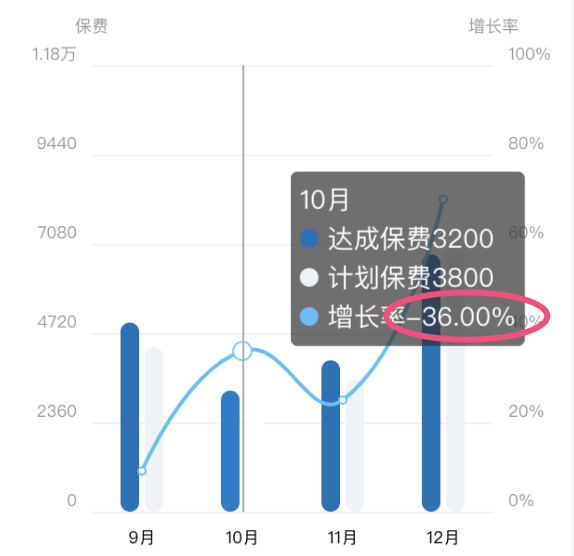

添加负号(负增长率显示)

tooltip配置,data传值时要注意呼应

tooltip : {
    trigger: 'axis',
    formatter:function(params)
    {
var relVal = params[0].name;
        for (var i = 0, l = params.length; i < l; i++) {
            i === 2 ? relVal += '<br/>' +params[i].marker+ params[i].seriesName  + params[i].name +"%" : relVal += '<br/>' +params[i].marker+ params[i].seriesName  + params[i].value;
        }
        return relVal;
    }
},
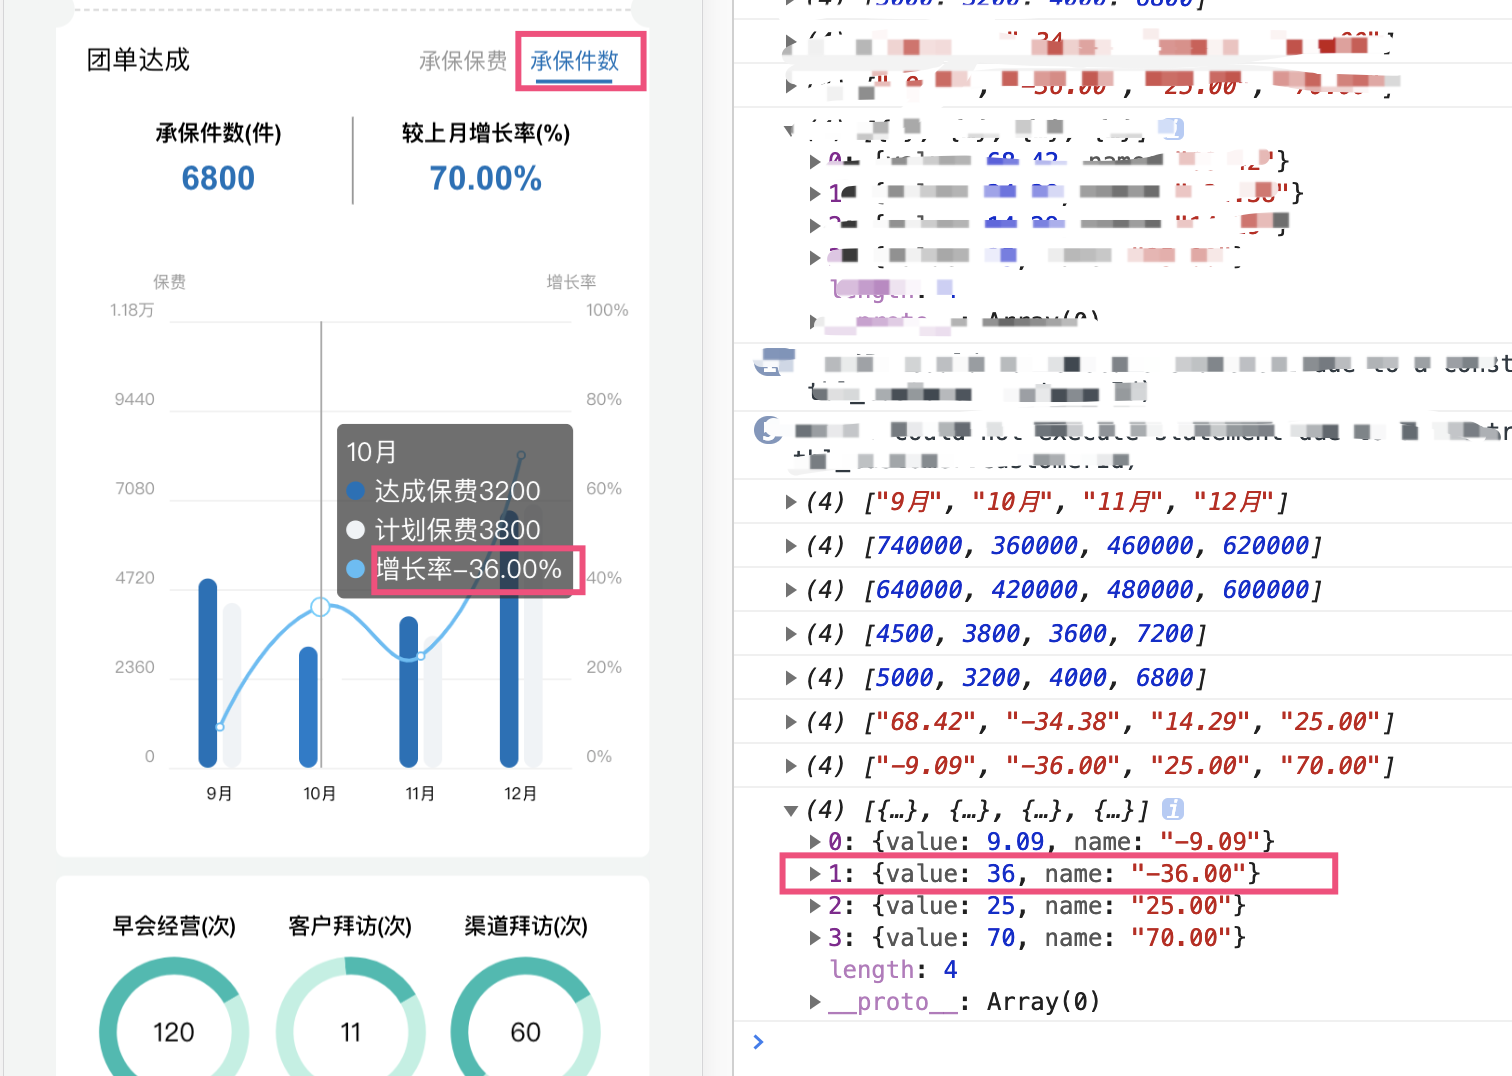
传值的时候要格式化下数据,和tooltip 里边的name相呼应
后台数据获得的数据处理一
["-9.09","-36.00","25.00","70.00"]
charts要传入的数组(value决定折线走势,name 是tooltip显示要显示的值)
后台数据获得的数据处理二
[{"value":9.09,"name":"-9.09"},{"value":36,"name":"-36.00"},{"value":25,"name":"25.00"},{"value":70,"name":"70.00"}]
note:配置增长率数据的时候要重新格式化下数据(添加一个 名字(此处采用name)/ 或者 echarts 中tooltip formatter函数参数params 里边的其他指定名字):
参数 params 是 formatter 需要的数据集。格式如下:
  {
      componentType: 'series',
      // 系列类型
      seriesType: string,
      // 系列在传入的 option.series 中的 index
      seriesIndex: number,
     // 系列名称
      seriesName: string,
      // 数据名,类目名
      name: string,
      // 数据在传入的 data 数组中的 index
      dataIndex: number,
      // 传入的原始数据项
      data: Object,
      // 传入的数据值
      value: number|Array,
      // 数据图形的颜色
      color: string,

      // 饼图的百分比
      percent: number,

    }
-------tip3--------
小插曲:table切换时两个echarts怎样正常显示?
将echarts初始化写在函数中,tab切换时候 调用下echarts初始化函数

-------tip4--------
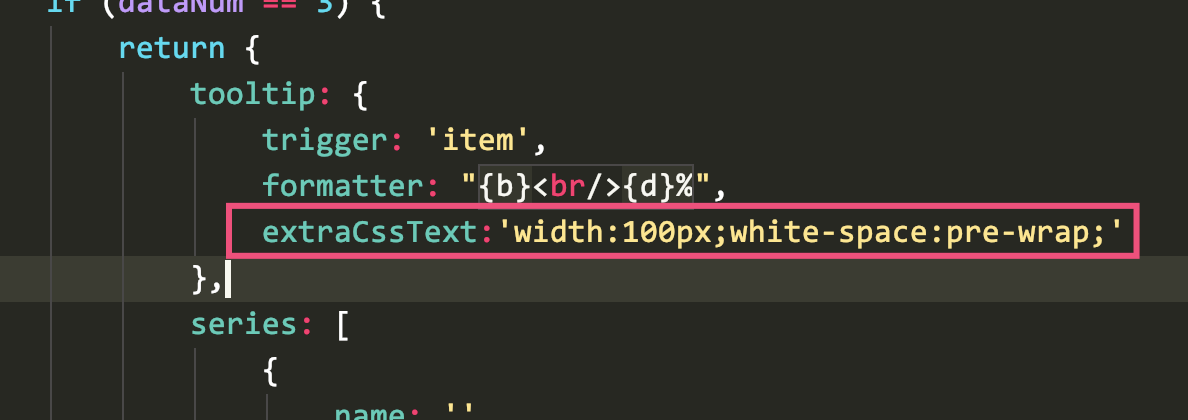
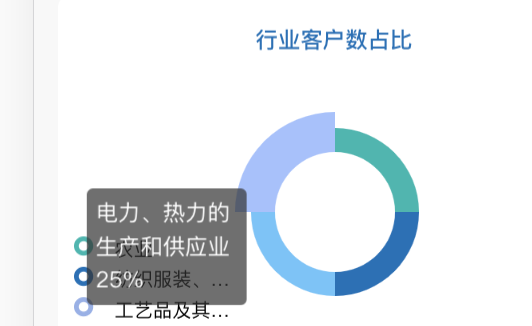
echarts 圆环数据 tooltip 过长超出屏幕处理方法:
extraCssText:'100px;white-space:pre-wrap;'
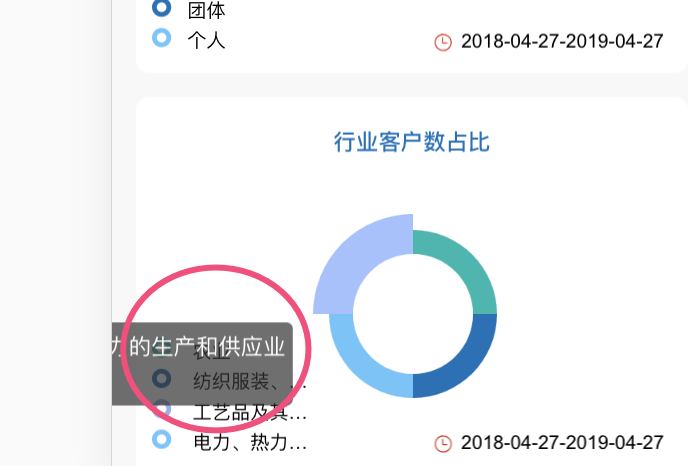
处理后:
<div ng-show="tabAct == 0" id="plan-pdt-charts-td" style=" 80vw;height: 320px;"></div>
<div ng-show="tabAct == 1" id="plan-pdt-charts-cb" style=" 80vw;height: 320px;"></div>
var formatRateArrFun = function(initArr,Arr){ for(var i = 0,len = initArr.length; i < len; i++){ Arr.push({value:Math.abs(initArr[i]),name:initArr[i]}); } } // 获取数组最大值 var getMaxVal = function(arr){ var maxVal = 0; for (var i = 0; i < arr.length; i++){ if(maxVal < arr[i]){ maxVal = arr[i]; } } return maxVal + 5000; }; var initChartFun = function(){ if($scope.tabAct == 0){ increaseRate =[]; echartActArr = initGpAchievePremiumActArr; echartPlanArr = initGpAchievePremiumArr; formatRateArrFun(initGpPremiumRateArr,increaseRate); }else if($scope.tabAct == 1){ increaseRate =[]; echartActArr = initGpAchieveNumActArr; echartPlanArr = initGpAchieveNumArr; formatRateArrFun(initGpAchieveNumRateArr,increaseRate); }; console.log(JSON.stringify(initGpAchieveNumRateArr)); console.log(JSON.stringify(increaseRate)); // 承保echarts配置option if($scope.doubleChart){ $scope.optionTd = { tooltip : { trigger: 'axis', textStyle:{ align:'left' }, formatter:function(params) { var relVal = params[0].name; for (var i = 0, l = params.length; i < l; i++) { if(i === 2){ relVal += '<br/>' +params[i].marker+ params[i].seriesName + params[i].name+"%"; }else{ if (params[i].value >= 10000 && params[i].value < 10000000) { params[i].value = params[i].value / 10000 + "万"; } else if (params[i].value >= 10000000) { params[i].value = params[i].value / 10000000 + "千万"; } relVal += '<br/>' +params[i].marker+ params[i].seriesName + params[i].value; } } return relVal; } }, grid: { top:'15%', right : '13%', bottom:'10%', left:'15%' }, toolbox : { feature : { dataView : { show : false, readOnly : false }, restore : { show : false }, saveAsImage : { show : false } } }, xAxis : [ { type : 'category', axisTick: { show: false }, axisLine: { show: true, lineStyle: { color: ['#f2f2f2'] } }, axisLabel: { verticalAlign: "top", color: "#000", fontSize:9, }, data : echartdateArr } ], yAxis : [ { type : 'value', name : '保费', nameTextStyle:{ color:"#999", fontSize:9, paddingBottom:5, }, min : 0, max : getMaxVal(echartActArr), interval:Math.ceil(getMaxVal(echartActArr)/5), position : 'left', axisTick: { show: false }, axisLine: { show: false, }, splitLine: { show: true, lineStyle: { color: ['#f2f2f2'] } }, axisLabel: { verticalAlign: "bottom", color: "#999", fontSize:9, formatter: function(value){ if (value >= 10000 && value < 10000000) { value = value / 10000 + "万"; } else if (value >= 10000000) { value = value / 10000000 + "千万"; } return value; } }, }, { type : 'value', // name : '计划保费', min : 0, max : getMaxVal(echartPlanArr), interval:Math.ceil(getMaxVal(echartPlanArr)/5), position : 'right', offset : 10000, splitLine: { show: false, }, }, { type : 'value', name : '增长率', nameTextStyle:{ color:"#999", fontSize:9, paddingBottom:5, }, min : 0, max : 100, position : 'right', axisTick: { show: false }, axisLine: { show: false, }, splitLine: { show: true, lineStyle: { color: ['#f2f2f2'] } }, axisLabel: { verticalAlign: "bottom", color: "#999", fontSize:9, formatter: function(value){ return value/100*100 + '%' } } } ], series : [ { name : '达成保费', type : 'bar', barWidth : 10, /*设置柱状图颜色*/ itemStyle: { normal: { color: '#0670ba', barBorderRadius: [10, 10, 10, 10], } }, data : echartActArr, }, { name : '计划保费', type : 'bar', yAxisIndex : 1, barWidth : 10, /*设置柱状图颜色*/ itemStyle: { normal: { color: '#f0f3f6', barBorderRadius: [10, 10, 10, 10], } }, data : echartPlanArr, }, { name : '增长率', type : 'line', yAxisIndex : 2, itemStyle : { normal : { color:'#54bdf6' } }, smooth:true, data : increaseRate, }] }; }else{ $scope.optionTd = { tooltip : { trigger: 'axis', textStyle:{ align:'left' }, formatter:function(params) { var relVal = params[0].name; for (var i = 0, l = params.length; i < l; i++) { if(i === 2){ relVal += '<br/>' +params[i].marker+ params[i].seriesName + params[i].name+"%"; }else{ if (params[i].value >= 10000 && params[i].value < 10000000) { params[i].value = params[i].value / 10000 + "万"; } else if (params[i].value >= 10000000) { params[i].value = params[i].value / 10000000 + "千万"; } relVal += '<br/>' +params[i].marker+ params[i].seriesName + params[i].value; } } return relVal; } }, grid: { top:'15%', right : '13%', bottom:'10%', left:'15%' }, toolbox : { feature : { dataView : { show : false, readOnly : false }, restore : { show : false }, saveAsImage : { show : false } } }, xAxis : [ { type : 'category', axisTick: { show: false }, axisLine: { show: true, lineStyle: { color: ['#f2f2f2'] } }, axisLabel: { verticalAlign: "top", color: "#000", fontSize:9, }, data : echartdateArr } ], yAxis : [ { type : 'value', name : '保费', nameTextStyle:{ color:"#999", fontSize:9, paddingBottom:5, }, min : 0, max : getMaxVal(echartActArr), interval:Math.ceil(getMaxVal(echartActArr)/5), position : 'left', axisTick: { show: false }, axisLine: { show: false, }, splitLine: { show: true, lineStyle: { color: ['#f2f2f2'] } }, axisLabel: { verticalAlign: "bottom", color: "#999", fontSize:9, formatter: function(value){ if (value >= 10000 && value < 10000000) { value = value / 10000 + "万"; } else if (value >= 10000000) { value = value / 10000000 + "千万"; } return value; } }, },{ type : 'value', name : '增长率', nameTextStyle:{ color:"#999", fontSize:9, paddingBottom:5, }, min : 0, max : 100, position : 'right', axisTick: { show: false }, axisLine: { show: false, }, splitLine: { show: true, lineStyle: { color: ['#f2f2f2'] } }, axisLabel: { verticalAlign: "bottom", color: "#999", fontSize:9, formatter: function(value){ return value/100*100 + '%' } } } ], series : [ { name : '达成保费', type : 'bar', barWidth : 10, /*设置柱状图颜色*/ itemStyle: { normal: { color: '#0670ba', barBorderRadius: [10, 10, 10, 10], } }, data : echartActArr, }, { name : '增长率', type : 'line', yAxisIndex : 1, itemStyle : { normal : { color:'#54bdf6' } }, smooth:true, data : increaseRate, }] }; } if($scope.tabAct == 0){ var tdChart = echarts.init(document.getElementById('plan-pdt-charts-td')); tdChart.setOption($scope.optionTd); }else if($scope.tabAct == 1){ var cbChart = echarts.init(document.getElementById('plan-pdt-charts-cb')); cbChart.setOption($scope.optionTd); } } initChartFun(); $scope.changeTabAct = function(tabAct) { $scope.tabAct = tabAct; if($scope.tabAct == 0){ initChartFun(); //初始化echarts }else if($scope.tabAct == 1){ initChartFun(); //初始化echarts } }