代码地址https://github.com/vijayvee/Recursive-neural-networks-TensorFlow
代码实现的是结构递归神经网络(Recursive NN,注意,不是Recurrent),里面需要构建树。代码写的有不少错误,一步步调试就能解决。主要是随着tensorflow版本的变更,一些函数的使用方式发生了变化。
2 数据样式
(3 (2 (2 The) (2 Rock)) (4 (3 (2 is) (4 (2 destined) (2 (2 (2 (2 (2 to) (2 (2 be) (2 (2 the) (2 (2 21st) (2 (2 (2 Century) (2 's)) (2 (3 new) (2 (2 ``) (2 Conan)))))))) (2 '')) (2 and)) (3 (2 that) (3 (2 he) (3 (2 's) (3 (2 going) (3 (2 to) (4 (3 (2 make) (3 (3 (2 a) (3 splash)) (2 (2 even) (3 greater)))) (2 (2 than) (2 (2 (2 (2 (1 (2 Arnold) (2 Schwarzenegger)) (2 ,)) (2 (2 Jean-Claud) (2 (2 Van) (2 Damme)))) (2 or)) (2 (2 Steven) (2 Segal))))))))))))) (2 .)))
(4 (4 (4 (2 The) (4 (3 gorgeously) (3 (2 elaborate) (2 continuation)))) (2 (2 (2 of) (2 ``)) (2 (2 The) (2 (2 (2 Lord) (2 (2 of) (2 (2 the) (2 Rings)))) (2 (2 '') (2 trilogy)))))) (2 (3 (2 (2 is) (2 (2 so) (2 huge))) (2 (2 that) (3 (2 (2 (2 a) (2 column)) (2 (2 of) (2 words))) (2 (2 (2 (2 can) (1 not)) (3 adequately)) (2 (2 describe) (2 (3 (2 (2 co-writer/director) (2 (2 Peter) (3 (2 Jackson) (2 's)))) (3 (2 expanded) (2 vision))) (2 (2 of) (2 (2 (2 J.R.R.) (2 (2 Tolkien) (2 's))) (2 Middle-earth))))))))) (2 .)))
这是两行数据,可以构建两棵树。
首先,以第一棵树为例,3是root节点,是label,只有叶子节点有word。word就是记录的单词。
3 依据文件构建树的主要处理过程:
    with open(file, 'r') as fid:

        trees = [Tree(l) for l in fid.readlines()]
Tree构建的时候:
    def __init__(self, treeString, openChar='(', closeChar=')'):
        tokens = []
        self.open = '('
        self.close = ')'
        for toks in treeString.strip().split():
            tokens += list(toks)
        self.root = self.parse(tokens)
        # get list of labels as obtained through a post-order traversal
        self.labels = get_labels(self.root)
        self.num_words = len(self.labels)
其中,程序得到的tokens,是如下形式:
tokens输出的是字符的列表,即[‘(’,’3’,’(’,’2’,‘(’,’2’,’(‘,’T’,’h’,’e’………………]
Parse函数处理:(递归构建树的过程),注意,其中的int('3')得到的是3,而不是字符'3'的ASCII码值。
Parse函数处理:(递归构建树的过程) def parse(self, tokens, parent=None): assert tokens[0] == self.open, "Malformed tree" assert tokens[-1] == self.close, "Malformed tree" split = 2 # position after open and label countOpen = countClose = 0 if tokens[split] == self.open: #假如是父节点,还有子节点的话,一定是(3(,即[2]对应的字符是一个open countOpen += 1 split += 1 # Find where left child and right child split #下面的while循环就是处理,可以看到,能够找到(2 (2 The) (2 Rock))字符序列是其左子树。 # while countOpen != countClose: if tokens[split] == self.open: countOpen += 1 if tokens[split] == self.close: countClose += 1 split += 1 # New node print (tokens[1],int(tokens[1])) node = Node(int(tokens[1])) # zero index labels node.parent = parent # leaf Node if countOpen == 0: #也就是叶子节点 node.word = ''.join(tokens[2:-1]).lower() # lower case? node.isLeaf = True return node node.left = self.parse(tokens[2:split], parent=node) node.right = self.parse(tokens[split:-1], parent=node) return node
4 networkx构建可视化二叉树
代码如下:
def plotTree_xiaojie(tree):

    positions,edges = _get_pos_edge_list(tree)
    nodes = [x for x in positions.keys()]
    labels = _get_label_list(tree)
    colors = []
    try:
        colors = _get_color_list(tree)
    except AttributeError:
        pass
    #使用networkx画图
    G=nx.Graph()
    G.add_edges_from(edges)
    G.add_nodes_from(nodes)

    if len(colors) > 0:
        nx.draw_networkx_nodes(G,positions,node_size=100,node_color=colors)
        nx.draw_networkx_edges(G,positions)
        nx.draw_networkx_labels(G,positions,labels,font_color='w')
    else:
        nx.draw_networkx_nodes(G,positions,node_size=100,node_color='r')
        nx.draw_networkx_edges(G,positions)
        nx.draw_networkx_labels(G,positions,labels)
    nx.draw(G)
    plt.axis('off')

    plt.savefig('./可视化二叉树__曾杰.jpg')
    plt.show()
    #官网提供的下面的两个方法,已经缺失了。
#    nx.draw_graphviz(G)
#    nx.write_dot(G,'xiaojie.dot')
    return None
其中,_get_pos_edge_list的主要作用是对树进行遍历,决定每个树节点在画布中的位置,比如root节点就在(0,0)坐标处,然后edge就是遍历树得到边。
def _get_pos_edge_list(tree):
    """
    _get_pos_list(tree) -> Mapping. Produces a mapping
    of nodes as keys, and their coordinates for plotting
    as values. Since pyplot or networkx don't have built in
    methods for plotting binary search trees, this somewhat
    choppy method has to be used.
    """
    return _get_pos_edge_list_from(tree,tree.root,{},[],0,(0,0),1.0)

dot = None
def _get_pos_edge_list_from(tree,node,poslst,edgelist,index,coords,gap):
    #利用先序遍历,遍历一颗树,将边和节点生成networkx可以识别的内容。
    """
    _get_pos_list_from(tree,node,poslst,index,coords,gap) -> Mapping.
    Produces a mapping of nodes as keys, and their coordinates for
    plotting as values.

    Non-straightforward arguments:
    index: represents the index of node in
    a list of all Nodes in tree in preorder.
    coords: represents coordinates of node's parent. Used to
    determine coordinates of node for plotting.
    gap: represents horizontal distance from node and node's parent.
    To achieve plotting consistency each time we move down the tree
    we half this value.
    """
    global dot
    positions = poslst
    edges=edgelist
    if node and node == tree.root:
        dot.node(str(index),str(node.label))
        positions[index] = coords
        new_index = 1 +index+tree.get_element_count(node.left)
        if node.left:
            edges.append((0,1))
            dot.edge(str(index),str(index+1),constraint='false')
            positions,edges = _get_pos_edge_list_from(tree,node.left,positions,edges,1,coords,gap)
        if node.right:
            edges.append((0,new_index))
            dot.edge(str(index),str(new_index),constraint='false')
            positions,edges = _get_pos_edge_list_from(tree,node.right,positions,edges,new_index,coords,gap)

        return positions,edges
    elif node:
        dot.node(str(index),str(node.label))
        if node.parent.right and node.parent.right == node:
            #new_coords = (coords[0]+gap,coords[1]-1) #这样的话,当节点过多的时候,很容易出现重合节点的情形。
            new_coords = (coords[0]+(tree.get_element_count(node.left)+1)*3,coords[1]-3)
            positions[index] = new_coords
        else:
            #new_coords = (coords[0]-gap,coords[1]-1)
            new_coords = (coords[0]-(tree.get_element_count(node.right)+1)*3,coords[1]-3)
            positions[index] = new_coords

        new_index = 1 + index + tree.get_element_count(node.left)
        if node.left:
            edges.append((index,index+1))
            dot.edge(str(index),str(index+1),constraint='false')
            positions,edges = _get_pos_edge_list_from(tree,node.left,positions,edges,index+1,new_coords,gap)
        if node.right:
            edges.append((index,new_index))
            dot.edge(str(index),str(new_index),constraint='false')
            positions,edges = _get_pos_edge_list_from(tree,node.right,positions,edges,new_index,new_coords,gap)

        return positions,edges
    else:
        return positions,edges
5 遇到的问题(画的树太丑了,不忍心看)
树画的特别的丑,而且能够对树进行描述的信息不多。这是我参考网上绘制二叉树的开源项目:
见博客地址:http://www.studyai.com/article/9bf95027,其中引用的两个库是BSTree
from pybst.bstree import BSTreefrom pybst.draw import plot_tree
由于BSTree有它自己的树结构,而我下载的RNN网络的树又是另外一种结构。于是,我只能修改BSTree的代码,产生了前述的代码,即plotTree_xiaojie,加入到RNN项目的源码当中去。
树是什么样子呢?

可以看到,在x轴中有重叠现象。
于是代码中有如下改动:
        if node.parent.right and node.parent.right == node:
            #new_coords = (coords[0]+gap,coords[1]-1) #这样的话,当节点过多的时候,很容易出现重合节点的情形。
            new_coords = (coords[0]+(tree.get_element_count(node.left)+1)*1,coords[1]-1)
            positions[index] = new_coords
        else:
            #new_coords = (coords[0]-gap,coords[1]-1)
            new_coords = (coords[0]-(tree.get_element_count(node.right)+1)*1,coords[1]-1)
            positions[index] = new_coords
即在x轴方向上从单纯的加减去一个1,而变成了加上和减去节点数确定的距离,如此一来,能够保证二叉树上的所有节点在x轴上不会出现重合。因为我画树的过程是先序遍历的方式,所以y轴上所有节点从根本上是不可能重合的。而子节点的位置必然要依据父节点的位置来断定,就会导致整颗树的节点,在x轴上出现重合。
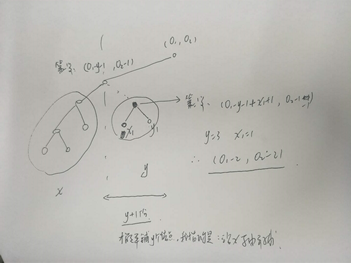
我画了一个手稿示意图如下:即依据子节点的左右子树的节点数,确立子节点与父节点的位置关系(父节点当前的位置是知道的,要确立子节点的位置)
优化后的二叉树长这个样子:

通过之前的树对比一下,可以发现没有节点重合了。但是为什么在根节点处出现一大片红色。这个原因不明确。但是通过对比前后两个图,是可以发现,3节点和其左子节点2之间,并没有其它的节点。
但是,图依旧很丑。
此外,networkx能够记录的信息有限。一个label是不够的。我希望能够展现出RNN的节点的当前的向量是多少,所以需要更丰富的展现形式。于是求助Graphviz
6 借助Graphviz展现二叉树
参考:
https://blog.csdn.net/a1368783069/article/details/52067404
使用Graphviz绘图(一)
https://www.cnblogs.com/taceywong/p/5439574.html
修改前述绘制树的plotTree_xiaojie程序如下:
def plotTree_xiaojie(tree):
    global dot
    dot=Digraph("G",format="pdf")

    positions,edges = _get_pos_edge_list(tree)
    nodes = [x for x in positions.keys()]
    labels = _get_label_list(tree)
    colors = []
    try:
        colors = _get_color_list(tree)
    except AttributeError:
        pass
    print(dot.source)
    f=open('可视化二叉树.dot', 'w+')
    f.write(dot.source)
    f.close()

    dot.view()

    #使用networkx画图
    G=nx.Graph()
    G.add_edges_from(edges)
    G.add_nodes_from(nodes)

    if len(colors) > 0:
        nx.draw_networkx_nodes(G,positions,node_size=40,node_color=colors)
        nx.draw_networkx_edges(G,positions)
        nx.draw_networkx_labels(G,positions,labels,font_color='w')
    else:
        nx.draw_networkx_nodes(G,positions,node_size=40,node_color='r')
        nx.draw_networkx_edges(G,positions)
        nx.draw_networkx_labels(G,positions,labels)
    nx.draw(G)
    plt.axis('off')

    plt.savefig('./可视化二叉树__曾杰.jpg')
    plt.show()
    #官网提供的下面的两个方法,已经缺失了。
#    nx.draw_graphviz(G)
#    nx.write_dot(G,'xiaojie.dot')
    return None
在对树进行遍历的_get_pos_edge_list函数中也添加了dot的相关添加节点和边的操作,见前述代码。前述代码中已经包含使用graphviz的相关操作了。
结果得到的图是这个死样子:
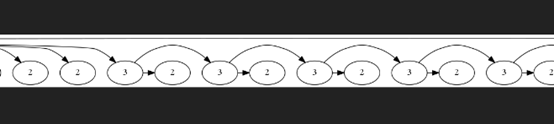
虽然节点和边的关系是对的。但是太丑了,这哪是一颗树。
博客:https://blog.csdn.net/theonegis/article/details/71772334宣称,能够将二叉树变得好看。使用如下代码:
dot tree.dot | gvpr -c -f binarytree.gvpr | neato -n -Tpng -o tree.png
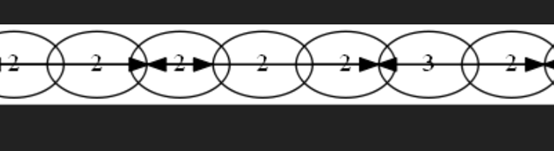
结果,更丑了。
7 抛出问题:如何更好的展现一颗二叉树,我希望用pygraphviz。
正在研究和使用中,后续更新在下篇博文中。
见本博客,2 pygraphviz在windows10 64位下的安装问题(反斜杠的血案)
更新博文 2018年8月23日17:21:45
8 使用pygraphviz绘制二叉树
代码修改如下:
def plotTree_xiaojie(tree):
    positions,edges = _get_pos_edge_list(tree)
    nodes = [x for x in positions.keys()]
    G=pgv.AGraph(name='xiaojie_draw_RtNN_Tree',directed=True,strict=True)
    G.add_nodes_from(nodes)
    G.add_edges_from(edges)
    G.layout('dot')
    G.draw('xiaojie_draw_RtNN_Tree.png')
    return None
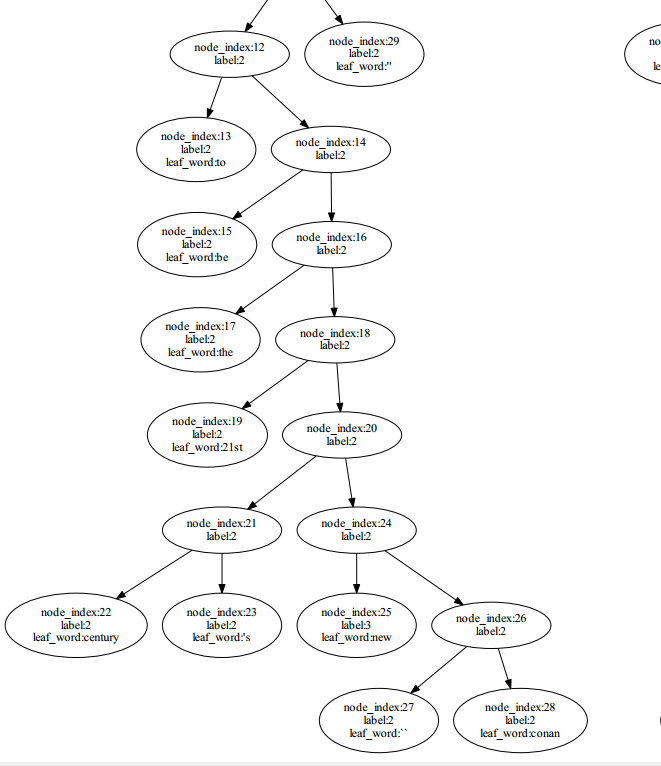
结果是:

是不是相当的好看?
而且还可以局部区域放大,完全是graphviz的强大特性。
这相当于什么了,把graphviz比作原版的android系统,然后pygraphviz就像是小米,oppo,华为等进行的升级版本。
哇咔咔。
可以对边的颜色,节点大小,还可以添加附加信息。比如我想添加节点当前的计算向量等等。
这样,一颗结构递归计算的树就出来了。留待后续更新。
下面是一颗树的局部区域展示。