看下CentOS版本
[root@test home]# cat /etc/centos-release
CentOS Linux release 7.5.1804 (Core)
1.创建用户
useradd elastic -m -U -p 密码
其中 -m 表示创建用户的主目录,在/home/username,-U 表示创建同名的组,-p表示密码
[root@test home]# adduser elastic -m -U -p Elastic2018
[root@test home]# ll /home/
总用量 0
drwx------  2 elastic elastic  62 10月 15 14:30 elastic
2.授权sudo
把admin用户添加到sudoers中
查找sudoers文件路径
[root@xnbtest home]# whereis sudoers
sudoers: /etc/sudoers.d /etc/sudoers /usr/share/man/man5/sudoers.5.gz
查看sudoers文件权限
[root@xnbtest home]# ls -l /etc/sudoers
-r--r----- 1 root root 3966 10月 10 10:36 /etc/sudoers
只有读权限,没有写权限,那么修改下:
[root@xnbtest home]# chmod -v u+w /etc/sudoers
mode of "/etc/sudoers" changed from 0440 (r--r-----) to 0640 (rw-r-----)
再看下权限,有写权限了:
[root@xnbtest home]# ls -l /etc/sudoers
-rw-r----- 1 root root 3966 10月 10 10:36 /etc/sudoers
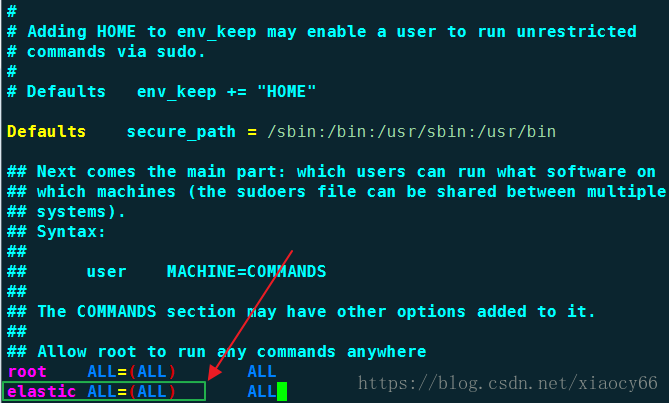
[root@xnbtest home]# vim /etc/sudoers
修改sudoers文件,添加elastic用户
保存后退出。
3.下载ElasticSearch、Kibana
下载elasticsearch6.4.2、kibana6.4.2到/home/tmp/download目录下(你也可以下载到你电脑再用ftp工具上传到CentOS的这个目录)
elasticsearch下载
Kibana下载
3.1 创建目录
先通过mkdir -p 创建下载目录:/home/tmp/download
[root@test home]# mkdir -p /home/tmp/download
-p 参数允许直接创建多级目录(如果中间的目录不存在时用这个方法非常好用,省得一级一级的创建)
3.2 下载文件
可以通过wget -P 下载文件到这个新创建的download目录,具体wget的用法参考:CentOS7.5 通过wget下载文件到指定目录
下载EslaticSearch :
[root@test tmp]# wget -P /home/tmp/download/ https://artifacts.elastic.co/downloads/elasticsearch/elasticsearch-6.4.2.tar.gz
--2018-10-15 14:48:23--  https://artifacts.elastic.co/downloads/elasticsearch/elasticsearch-6.4.2.tar.gz
正在解析主机 artifacts.elastic.co (artifacts.elastic.co)... 54.235.171.120, 107.21.202.15, 54.225.214.74, ...
正在连接 artifacts.elastic.co (artifacts.elastic.co)|54.235.171.120|:443... 已连接。
已发出 HTTP 请求,正在等待回应... 200 OK
长度:97914519 (93M) [application/x-gzip]
正在保存至: “/home/tmp/download/elasticsearch-6.4.2.tar.gz”

100%[===============================================================================>] 97,914,519  6.00MB/s 用时 19s

2018-10-15 14:48:44 (4.87 MB/s) - 已保存 “/home/tmp/download/elasticsearch-6.4.2.tar.gz” [97914519/97914519])

[root@test tmp]#
下载Kibana :
[root@test tmp]# wget -P /home/tmp/download/ https://artifacts.elastic.co/downloads/kibana/kibana-6.4.2-linux-x86_64.tar.gz
--2018-10-15 14:51:36--  https://artifacts.elastic.co/downloads/kibana/kibana-6.4.2-linux-x86_64.tar.gz
正在解析主机 artifacts.elastic.co (artifacts.elastic.co)... 107.21.202.15, 107.21.237.188, 54.225.214.74, ...
正在连接 artifacts.elastic.co (artifacts.elastic.co)|107.21.202.15|:443... 已连接。
已发出 HTTP 请求,正在等待回应... 200 OK
长度:188077286 (179M) [application/x-gzip]
正在保存至: “/home/tmp/download/kibana-6.4.2-linux-x86_64.tar.gz”

100%[===============================================================================>] 188,077,286 5.84MB/s 用时 43s

2018-10-15 14:52:20 (4.15 MB/s) - 已保存 “/home/tmp/download/kibana-6.4.2-linux-x86_64.tar.gz” [188077286/188077286])

[root@test tmp]#
切换到elastic用户:
[root@test home]# su elastic
[elastic@test home]
[elastic@test ~]$ cd /home/elastic/
解压刚才下载的tar包到elastic用户主目录:
[elastic@test ~]$ tar -zxvf ../tmp/download/elasticsearch-6.4.2.tar.gz -C /home/elastic/
elasticsearch-6.4.2/
elasticsearch-6.4.2/lib/
elasticsearch-6.4.2/lib/elasticsearch-6.4.2.jar
elasticsearch-6.4.2/lib/elasticsearch-x-content-6.4.2.jar
........
[elastic@test ~]$
[elastic@test ~]$ tar -zxf ../tmp/download/kibana-6.4.2-linux-x86_64.tar.gz -C /home/elastic/
[elastic@test ~]$
4.配置Elasticsearch
配置elasticsearch:
[elastic@xnbtest ~]$ vim ./elasticsearch-6.4.2/config/elasticsearch.yml
添加以下内容:
# 集群名
cluster.name: es

# 当前节点名
node.name: node-1

# 数据目录
path.data: /home/elastic/es_data/data

# 日志目录
path.logs: /home/elastic/es_data/logs

# 配置es绑定的ip(这里根据你的ip修改)
network.host: 192.168.1.242

# 设置对外服务的http访问端口
http.port: 9200

# 设置节点间交互的tcp端口,默认是9300。
transport.tcp.port: 9300

# 集群节点列表
discovery.zen.ping.unicast.hosts: ["192.168.1.242:9300",]

# 节点
discovery.zen.minimum_master_nodes: 1

# 由于当jvm开始swapping时es的效率会降低,所以要保证它不swap,这对节点健康极其重要。实现这一目标的一种方法是将 bootstrap.memory_lock 设置为true。
bootstrap.memory_lock: true
下面启动es:
[elastic@test ~]$ ./elasticsearch-6.4.2/bin/elasticsearch
.......
ERROR: [1] bootstrap checks failed
[1]: memory locking requested for elasticsearch process but memory is not locked
[2018-10-15T16:11:48,136][INFO ][o.e.n.Node               ] [node-1] stopping ...
[2018-10-15T16:11:48,160][INFO ][o.e.n.Node               ] [node-1] stopped
[2018-10-15T16:11:48,160][INFO ][o.e.n.Node               ] [node-1] closing ...
[2018-10-15T16:11:48,168][INFO ][o.e.n.Node               ] [node-1] closed
提示内存锁定失败
解决:切换到root用户,编辑limits.conf配置文件, 添加类似如下内容:
sudo vim /etc/security/limits.conf
添加如下内容:
elastic soft memlock unlimited
elastic hard memlock unlimited
备注: elastic 代表Linux用户名称,当然你也可以直接用*代替,表示给本机所有用户配置,然后保存、退出、重新登录才可生效
..........
..........
#*               soft    core            0
#*               hard    rss             10000
#@student        hard    nproc           20
#@faculty        soft    nproc           20
#@faculty        hard    nproc           50
#ftp             hard    nproc           0
#@student        -       maxlogins       4

elastic soft memlock unlimited
elastic hard memlock unlimited

"/etc/security/limits.conf" 71L, 2539C written
[root@test elastic]#
再次启动,成功了:
[elastic@test ~]$ ./elasticsearch-6.4.2/bin/elasticsearch
[2018-10-15T16:19:28,870][INFO ][o.e.n.Node               ] [node-1] initializing ...
[2018-10-15T16:19:28,913][INFO ][o.e.e.NodeEnvironment    ] [node-1] using [1] data paths, mounts [[/home (/dev/sda5)]], net usable_space [157.2gb], net total_space [164.5gb], types [xfs]
[2018-10-15T16:19:28,914][INFO ][o.e.e.NodeEnvironment    ] [node-1] heap size [990.7mb], compressed ordinary object pointers [true]
[2018-10-15T16:19:28,915][INFO ][o.e.n.Node               ] [node-1] node name [node-1], node ID [pNuLUs7PQi64-mP42lOOgg]
[2018-10-15T16:19:28,915][INFO ][o.e.n.Node               ] [node-1] version[6.4.2], pid[11399], build[default/tar/04711c2/2018-09-26T13:34:09.098244Z], OS[Linux/3.10.0-862.el7.x86_64/amd64], JVM[Oracle Corporation/Java HotSpot(TM) 64-Bit Server VM/1.8.0_181/25.181-b13]
......
......
[2018-10-15T16:19:37,358][INFO ][o.e.c.m.MetaDataIndexTemplateService] [node-1] adding template [.monitoring-kibana] for index patterns [.monitoring-kibana-6-*]
[2018-10-15T16:19:37,435][INFO ][o.e.l.LicenseService     ] [node-1] license [7bf03744-414a-4fd8-9e00-85906d19505c] mode [basic] - valid
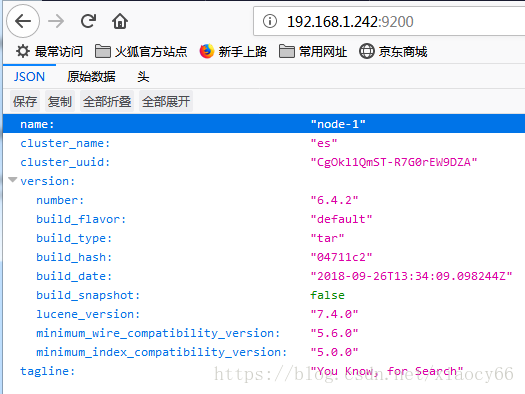
我们在浏览器打开部署成功的es: http://192.168.1.242:9200,结果如下图所示:
5.配置Kibana
配置kibana:
这个只要简单配置一下就能用了,我们修改config目录的kibana.yml文件设置elasticsearch的url地址即可:
server.port: 5601
server.host: "192.168.1.242"
# The URL of the Elasticsearch instance to use for all your queries.
elasticsearch.url: "http://192.168.1.242:9200"
上面第一个参数是kibana对外提供服务的端口;第二个参数是kibana对外提供服务的访问url;第三个参数是前面配置好的elasticsearch对外提供服务的访问url
启动kibana:
[elastic@xnbtest ~]$ ./kibana-6.4.2-linux-x86_64/bin/kibana
  log   [08:29:23.981] [info][status][plugin:kibana@6.4.2] Status changed from uninitialized to green - Ready
  log   [08:29:24.005] [info][status][plugin:elasticsearch@6.4.2] Status changed from uninitialized to yellow - Waiting for Elasticsearch
  ......
  log   [08:29:25.046] [info][status][plugin:tilemap@6.4.2] Status changed from yellow to green - Ready
  log   [08:29:25.046] [info][status][plugin:watcher@6.4.2] Status changed from yellow to green - Ready
  log   [08:29:25.046] [info][status][plugin:index_management@6.4.2] Status changed from yellow to green - Ready
  log   [08:29:25.047] [info][status][plugin:graph@6.4.2] Status changed from yellow to green - Ready
  ......
  log   [08:29:25.048] [info][kibana-monitoring][monitoring-ui] Starting monitoring stats collection
  log   [08:29:25.050] [info][status][plugin:security@6.4.2] Status changed from yellow to green - Ready
  log   [08:29:25.288] [info][license][xpack] Imported license information from Elasticsearch for the [monitoring] cluster: mode: basic | status: active
  log   [08:29:34.443] [info][listening][server][http] Server running at http://192.168.1.242:5601
启动成功,下面我们打开kibana首页:http://192.168.1.242:5601,结果如下:
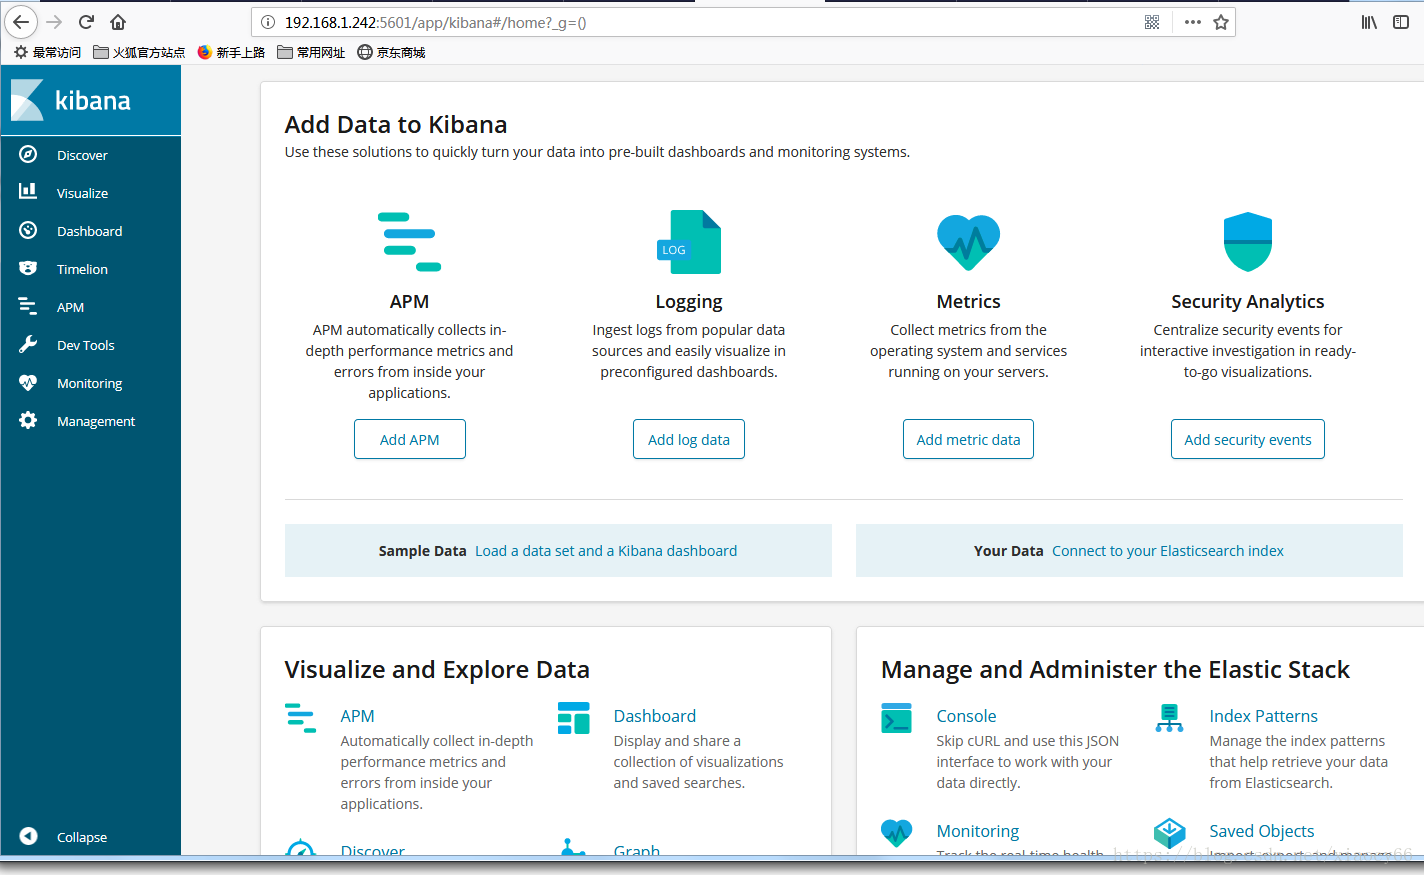
简直是棒棒哒感觉有木有?
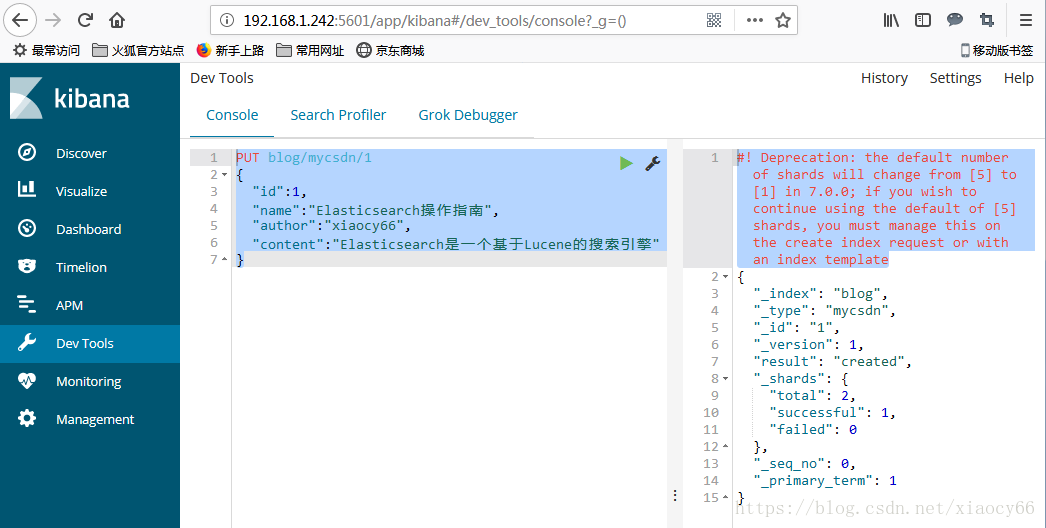
我们试着通过kibana往里面加数据:
PUT blog/mycsdn/1
{
  "id":1,
  "name":"Elasticsearch操作指南",
  "author":"xiaocy66",
  "content":"Elasticsearch是一个基于Lucene的搜索引擎"
}
结果如下:
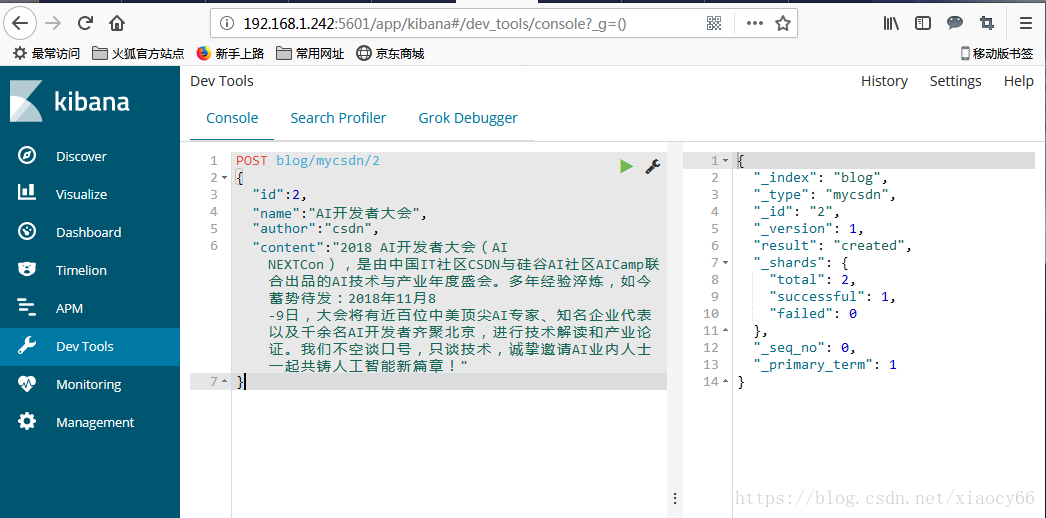
再加一条数据如下图所示:
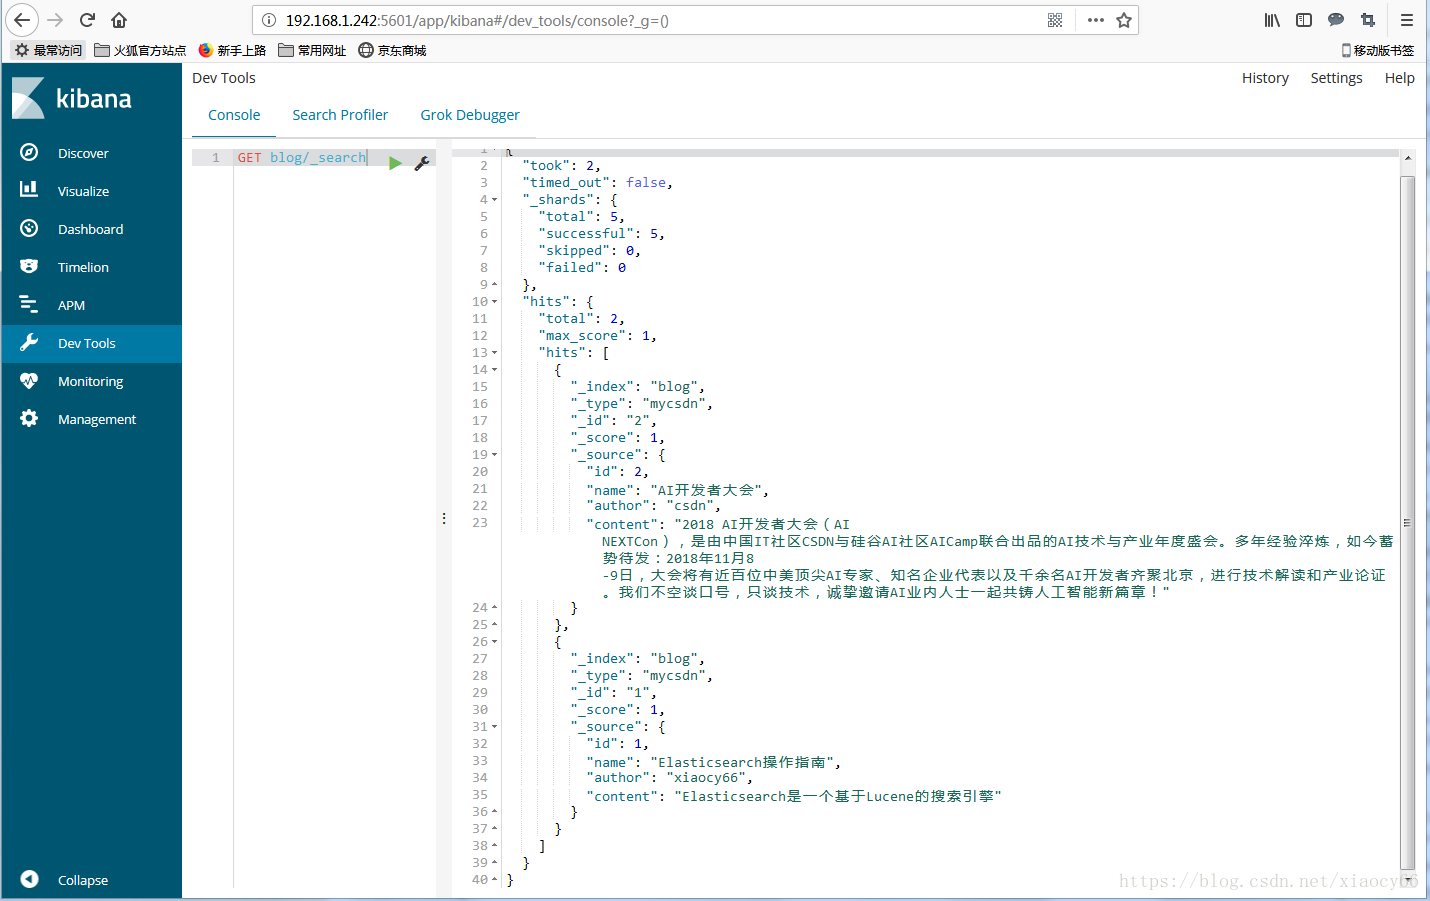
然后我们查下刚刚成功加入的blog索引下面的文档数据:
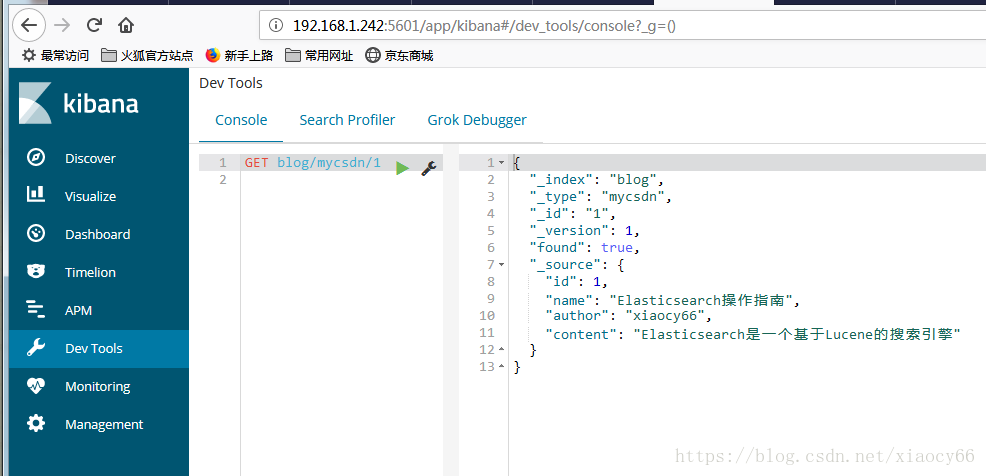
通过id查询单个数据:
赞一个~ 收工啦
参考资料:
[1]: Kibana官方文档
[2]: elasticsearch官方文档
[3]: 其他所有分享过ElasticEearch填坑的网友的经验