最近经常要画好看的盒形图,还要在上面加入散点,所以总结了两个方法。
第一种方法是,利用beeswarm函数:
library(beeswarm) beeswarm 蜜蜂群图
http://rgm3.lab.nig.ac.jp/RGM/r_function?p=beeswarm&f=beeswarm
可以结合盒形图展示。
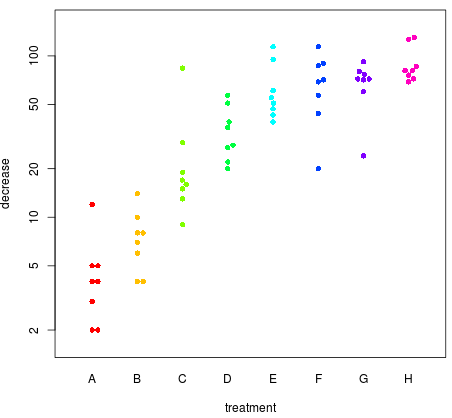
有多种布局方法method = c("swarm", "center", "hex", "square"),通过spacing = 1来控制点的密集程度
另一个方法是,利用jitter函数加入随机波动:
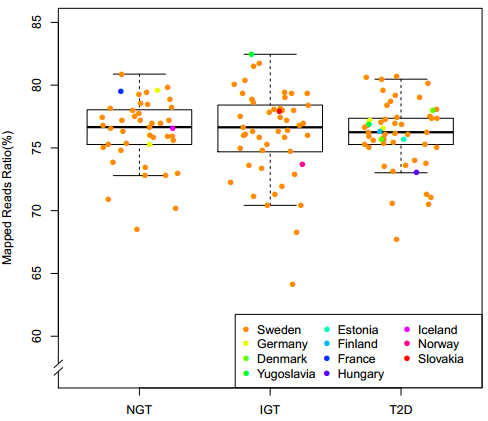
以下是代码:
先按照Group1的顺序画好盒形图,加入断轴,
再按照Group1排序(1、2、3组)加入波动,波动的变量xx就是新的横坐标,然后再画散点图就行了。
图中因为有些点多有些点少,画散点的时候我按照点多的颜色先画的原则(避免点少的颜色被覆盖看不到了),所以最后画点又排了次序。
boxplot(Ratio~Group1,data=dat,ylab="Mapped Reads Ratio(%)",outline=F,names=c("NGT","IGT","T2D"),ylim=c(57,85))
library(plotrix)
axis.break(2,57.5)
num=table(dat[,"Group1"])
xx=jitter(c(rep(1,num[1]), rep(2, num[2]), rep(3,num[3])),amount=0.3)#加入波动
dat2=dat[order(dat[,"Group1"]),]
dat3=cbind(dat2,xx)
dat4=dat3[order(dat3[,"Group2"]),]#按照国家排序画图
points(dat4[,7],dat4[,2],col=rainbow(11)[(dat4[,"Group2"]+11)%%11+1],pch=16)
dat5=dat[order(dat[,"Group2"]),]
leg=unique(cbind(as.vector(dat5[,4]),dat5[,6]))
legend("bottomright", as.vector(leg[,1]), col=rainbow(11)[(seq(1,11)+11)%%11+1],pch = 16, ncol = 3, cex =1)