一、环境
语言:python3
二、作用
直接转化数据,生成带表格的图片
三、代码
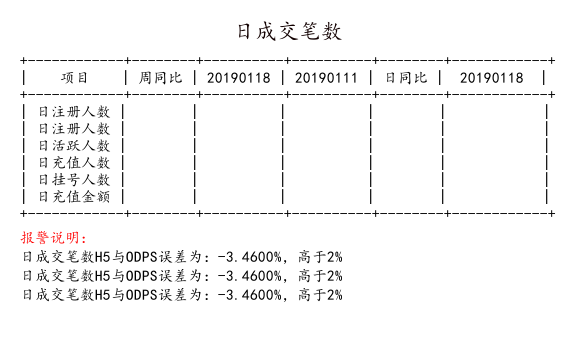
#!/usr/bin/python3
# -*- coding: utf-8 -*-
## author:qianqiu
from prettytable import PrettyTable
from PIL import Image, ImageDraw, ImageFont

def create_table_img(data,img_name, **kwargs):
    '''
        img_name 图片名称 'D:/project/pythonwork/12306/t.png' 或 t.png
        data 表格内容,首行为表头部
        table_title 表格标题
        line_height 底部描述行高
        font 默认字体路径
        default_font_size 默认字体大小
        default_background_color 图片背景底色
        table_top_heght 设置表格顶部留白高度
        table_botton_heght 设置表格顶部留白高度
        describe 底部描述文字
    '''
    space = 20 ## 表格边距
    # 生成图片-------------------------------
    ### 底部描述行高
    if 'line_height' not in kwargs:
         line_height = 4
    else:
        line_height = kwargs['line_height']

    ### 默认字体
    if 'font' not in kwargs:
         kwargs['font'] = None

    ### 默认字体大小
    if 'default_font_size' not in kwargs:
         kwargs['default_font_size'] = 15

    ### 默认表标题字体大小
    if 'table_title_font_size' not in kwargs:
         kwargs['table_title_font_size'] = 22


    ### 图片背景底色
    if 'default_background_color' not in kwargs:
         kwargs['default_background_color'] = (255,255,255,255)

    ### 设置表格顶部留白高度
    if 'table_top_heght' not in kwargs:
         kwargs['table_top_heght'] = kwargs['table_title_font_size'] + space + int(kwargs['table_title_font_size']/2)

    ## 底部描述文字
    if 'describe' in kwargs:
        describe_len = len(kwargs['describe'])
    else:
        describe_len = 0

    ### 设置表格底部留白高度
    if 'table_botton_heght' not in kwargs:
         kwargs['table_botton_heght'] = describe_len * kwargs['default_font_size'] + space

    ### 图片后缀
    if 'img_type' not in kwargs:
         kwargs['img_type'] = 'PNG'

    ### 默认字体及字体大小
    font = ImageFont.truetype(kwargs['font'], kwargs['default_font_size'], encoding='utf-8')
    font2 = ImageFont.truetype(kwargs['font'], kwargs['table_title_font_size'], encoding='utf-8')
    ## Image模块创建一个图片对象
    im = Image.new('RGB',(10, 10),kwargs['default_background_color'])
    ## ImageDraw向图片中进行操作,写入文字或者插入线条都可以
    draw = ImageDraw.Draw(im)

    # 创建表格---------------------------------
    tab = PrettyTable(border=True, header=True, header_style = 'title')
    ## 第一行设置为表头
    tab.field_names = data.pop(0)
    for row in data:
        tab.add_row(row)
    tab_info = str(tab)
    ## 根据插入图片中的文字内容和字体信息,来确定图片的最终大小
    img_size = draw.multiline_textsize(tab_info, font=font)
    img_width = img_size[0]+space*2
    table_height = img_size[1]+space*2
    img_height = table_height + kwargs['table_botton_heght'] + kwargs['table_top_heght']
    im_new = im.resize((img_width, img_height))
    del draw
    del im
    draw = ImageDraw.Draw(im_new, 'RGB')
    draw.multiline_text((space,kwargs['table_top_heght']), tab_info + '

', fill=(0,0,0), font=font)

    ### 表标题--------------------------
if 'table_title' in kwargs:
title_left_padding = (img_width - len(table_title) * kwargs['table_title_font_size']) / 2
draw.multiline_text((title_left_padding, space), table_title, fill=(17,0,0), font=font2, align = 'center')
    y = table_height + space/2

    ### 描述内容-----------------------------------
    if 'describe' in kwargs:
        y = y + kwargs['default_font_size']
        frist_row = kwargs['describe'].pop(0)
        draw.text((space,y), frist_row, fill=(255,0,0), font=font)
        for describe_row in kwargs['describe']:
            y = y + kwargs['default_font_size'] + line_height
            draw.text((space,y), describe_row, fill=(0,0,0), font=font)
    del draw
    ### 保存为图片
    im_new.save(img_name, kwargs['img_type'])
    return True


if __name__ == "__main__":
    data = [
         ["项目", "周同比","20190118","20190111","日同比"," 20190118 "],
         ['日注册人数',' ',' ',' ',' ',' '],
         ['日注册人数',' ',' ',' ',' ',' '],
         ['日活跃人数',' ',' ',' ',' ',' '],
         ['日充值人数',' ',' ',' ',' ',' '],
         ['日挂号人数',' ',' ',' ',' ',' '],
         ['日充值金额',' ',' ',' ',' ',' ']
    ]
    describe = ['报警说明:','日成交笔数H5与ODPS误差为:-3.4600%,高于2%','日成交笔数H5与ODPS误差为:-3.4600%,高于2%','日成交笔数H5与ODPS误差为:-3.4600%,高于2%']
    table_title = '日成交笔数'
    result = create_table_img(data,'t1.png', font = 'C:WindowsFontssimkai.ttf',describe = describe, table_title = table_title)
    if result:
        print('图表生成成功')
四、最终效果