一、 环境准备:
3台Linux服务器,系统为CentOS 7.5
角色划分:
3台机器全部安装jdk1.8,全部安装elasticsearch (后续都简称为es集群)
主节点上需要安装kibana与logstash
ELK版本信息为7.1.1,你可以从官网下,也可以直接从下面地址下载:
https://artifacts.elastic.co/downloads/logstash/logstash-7.1.1.tar.gz
https://artifacts.elastic.co/downloads/elasticsearch/elasticsearch-7.1.1-linux-x86_64.tar.gz
https://artifacts.elastic.co/downloads/beats/filebeat/filebeat-7.1.1-linux-x86_64.tar.gz
https://artifacts.elastic.co/downloads/kibana/kibana-7.1.1-linux-x86_64.tar.gz
关闭防火墙(如果因为其他原因不能关闭防火墙,也请不要禁止80端口):systemctl stop firewalld.service
禁止防火墙自动启动:systemctl disable firewalld.service
关闭selinux : setenforce 0
禁止selinux启动:vim /etc/selinux/config
SELINUX=disabled
打开文件vim /etc/security/limits.conf,添加下面四行内容:
* soft nofile 65536
* hard nofile 131072
* soft nproc 2048
* hard nproc 4096
打开文件vim /etc/sysctl.conf,添加下面一行内容:
vm.max_map_count=655360
加载sysctl配置,执行命令:sysctl -p
各节点配置hosts解析,内容如下:
10.0.0.11 node01
10.0.0.12 node02
10.0.0.13 node03
二、 安装java环境
安装包版本:jdk-8u25-linux-x64.tar.gz
tar xf jdk-8u25-linux-x64.tar.gz -C /opt/
cd /opt/
ln -s jdk1.8.0_211 jdk
添加环境变量
sed -i.ori '$a export JAVA_HOME=/opt/jdk
export PATH=$JAVA_HOME/bin:$JAVA_HOME/jre/bin:$PATH
export CLASSPATH=.:$JAVA_HOME/lib:$JAVA_HOME/jre/lib:$JAVA_HOME/lib/tools.jar' /etc/profile
加载环境变量
source /etc/profile
查看版本
java -version
三、 安装Elasticsearch(简称ES)集群
tar xf elasticsearch-7.1.1-linux-x86_64.tar.gz -C /usr/local/src/
ln -s /usr/local/src/elasticsearch-7.1.1 /usr/local/elasticsearch
ElasticSerach要求以非root身份启动
在每个节点创建用户及用户组
groupadd elasticsearch
useradd elasticsearch -g elasticsearch
在每个节点上创建数据data和logs目录:
mkdir -p /data/elasticsearch/{data,logs}
chown -R elasticsearch. /data/elasticsearch/
chown -R elasticsearch. /usr/local/elasticsearch/
修改elasticsearch.yml配置文件
vim /usr/local/elasticsearch/config/elasticsearch.yml
path.data: /data/elasticsearch/data #数据
path.logs: /data/elasticsearch/logs #日志
cluster.name: elasticsearch # 集群中的名称
cluster.initial_master_nodes: ["node01","node02","node03"] #主节点
node.name: node01 # 该节点名称,与前面配置hosts保持一致
node.master: true # 意思是该节点是否可选举为主节点
node.data: true # 表示这不是数据节点
network.host: 0.0.0.0 # 监听全部ip,在实际环境中应为一个安全的ip
http.port: 9200 # es服务的端口号
http.cors.enabled: true
http.cors.allow-origin: "*"
discovery.zen.ping.unicast.hosts: ["node01", "node02", "node03"] # 配置自动发现
discovery.zen.minimum_master_nodes: 2 #防止集群“脑裂”,需要配置集群最少主节点数目,通常为 (主节点数目/2) + 1
elasticsearch是非常消耗cpu,在实际生产中,需要将初始申请的JVM内存调高,默认是1G
vim /usr/local/elasticsearch/config/jvm.options
#修改这两行
-Xms8g #设置最小堆的值为8g
-Xmx8g #设置组大堆的值为8g
在配置好相应的节点后,首先启动主节点,然后在启动相应节点
su - elasticsearch
cd /usr/local/elasticsearch/bin/
./elasticsearch -d
稍等会儿,通过查看段口,看到9200与9300端口号,表示服务已经启动。
ss -lntup
查看集群的健康信息:
curl 'localhost:9200/_cluster/health?pretty'
查看集群的详细信息:
curl 'localhost:9200/_cluster/state?pretty'
查询索引列表:
curl -XGET http://localhost:9200/_cat/indices?v
创建索引:
curl -XPUT http://localhost:9200/customer?pretty
查询索引:
curl -XGET http://localhost:9200/customer/external/1?pretty
删除索引:
curl -XDELETE http://localhost:9200/customer?pretty
删除指定索引:
curl -XDELETE node01:9200/system-log-2019.06
删除多个索引:
curl -XDELETE node01:9200/system-log-2019.0606,system-log-2019.0607
删除所有索引:
curl -XDELETE node01:9200/_all
在删除数据时,通常不建议使用通配符,误删后果会很严重,所有的index都可能被删除,为了安全起见需要禁止通配符,可以在elasticsearch.yml配置文件中设置禁用_all和*通配符
action.destructive_requires_name: true
安装集群head插件,可以参照ELK7.1.1之插件安装,方便查看与管理集群。
四、安装logstash
在主节点上进行部署
tar xf logstash-7.1.1.tar.gz -C /usr/local/src/
ln -s /usr/local/src/logstash-7.1.1 /usr/local/logstash
mkdir -p /data/logstash/{logs,data}
修改logstash配置
vim /usr/local/logstash/config/logstash.yml
#pipeline 线程数(CPU内核数或几倍cpu内核数)
pipeline.workers: 15
# 实际output 时的线程数
pipeline.output.workers: 15
#每次发送的事件数
pipeline.batch.size: 5000
#批处理的最大等待值
pipeline.batch.delay: 10
http.host: "node01"
path.data: /data/logstash/data
path.logs: /data/logstash/logs
xpack.monitoring.enabled: true #kibana监控插件中启动监控logstash
xpack.monitoring.elasticsearch.hosts: ["node01:9200","node02:9200","node03:9200"]
添加logstash收集日志配置,详细配置可以参照logstash配置文件详解
vim /usr/local/logstash/logstash.conf
input {
        beats {
            port => "5044"
        }
    }
filter {
    grok {
         match => ["message", "[?%{TIMESTAMP_ISO8601:timestamp}]? [?%{LOGLEVEL:level}]? [?%{JAVACLASS:class}]? - %{JAVALOGMESSAGE:logmessage}"]
         remove_field => ["input"]
         remove_field => ["message"]
  }
}
#多输出分片,数据量大,不能只弄一个分片(默认情况下一个分片索引速率在4000/s)
output{
  if "sunline_error" in [tags] {
    elasticsearch {
        hosts => ["node01:9200","node02:9200","node03:9200"]
        index => "sunline_error-%{+YYYY.MM.dd}"
     }
   }
  if "sunline_info" in [tags] {
    elasticsearch {
        hosts => ["node01:9200","node02:9200","node03:9200"]
        index => "sunline_info-%{+YYYY.MM.dd}"
     }
   }
}
grok大约有120种模式,你可以在这找到https://github.com/logstash-plugins/logstash-patterns-core/tree/master/patterns
启动服务
cd /usr/local/logstash
nohup bin/logstash -f logstash.conf -r &
命令说明:
-f 指定配置文件
-r 重载
--path.settings 用于指定logstash的配置文件所在的目录
-t 指定检测完之后就退出
logstash 高级用法pipelines
详细见:https://www.cnblogs.com/wzxmt/p/13083281.html
五、安装kibana
tar xf kibana-7.1.1-linux-x86_64.tar.gz -C /usr/local/src/
ln -s /usr/local/src/kibana-7.1.1-linux-x86_64 /usr/local/kibana
mkdir -p /data/kibana/logs/
修改kibana配置
vim /usr/local/kibana/config/kibana.yml
server.port: 5601 # 配置kibana的端口
server.host: 127.0.0.1 # 配置监听ip(设置本地ip使用nginx认证登录)
elasticsearch.hosts: ["http://node01:9200","http://node02:9200","http://node03:9200"] # 配置es服务器的ip
logging.dest: /data/kibana/logs/kibana.log # 配置kibana的日志文件路径,默认messages
i18n.locale: "zh-CN" #配置中文语言
启动服务
cd /usr/local/kibana
nohup bin/kibana &
六、安装filebeat
tar xf filebeat-7.1.1-linux-x86_64.tar.gz -C /usr/local/src/
ln -s /usr/local/src/filebeat-7.1.1-linux-x86_64 /usr/local/filebeat
修改配置,详细配置可参照filebeat配置详解
vim /usr/local/filebeat/filebeat.yml
output.logstash:
  hosts: ["10.0.0.11:5044"]

filebeat.config.modules:
  path: ${path.config}/modules.d/*.yml
  reload.enabled: false

setup.template.settings:
  index.number_of_shards: 3

filebeat.inputs:
- type: log
  tags: ["sunline_error"]
  enabled: true
  paths:
    - /home/sunline/adviser/logs/*.log*
  encoding: gbk
  exclude_lines: ['^INFO']
  exclude_files: ['.gz$']
  include_lines: ['ERR','WARN','ERROR','Error']
  multiline.pattern: '^[0-9]{4}-[0-9]{2}-[0-9]{2}'
  multiline.negate: true
  multiline.match: after
  close_inactive: 1h

- type: log
  tags: ["sunline_info"]
  enabled: true
  paths:
    - /home/sunline/adviser/logs/** #表示logs目录下的所有文件(最高八级子目录)
  encoding: gbk #字符集
  exclude_lines: ['ERR','WARN','ERROR','Error']
  include_lines: ['^INFO'] #排除某行
  exclude_files: ['.gz$'] #排除某个文件
  multiline.pattern: '^[0-9]{4}-[0-9]{2}-[0-9]{2}' #将以*开头为起始位置
  multiline.negate: true
  multiline.match: after
  close_inactive: 1h #表示1小时未导入,超时退出
  tail_files: true  #只会导入写入的数据(第一次导入,最好用这个参数,防止导入不必要的数据)
#要添加多个路径,只需要填加:
- type: log
  enabled: true
  paths:
    - /var/log/nginx/*.log
启动filebeat
cd /usr/local/filebeat/
nohup ./filebeat -e -c filebeat.yml &
通过tail -f nohup.out 可以看到我们的服务已经启动!
七、 kibana平台增加安全认证
kibana是nodejs开发的,本身并没有任何安全限制,直接浏览url就能访问,如果公网环境非常不安全,可以通过nginx请求转发增加认证,方法如下:
yum install -y nginx httpd-tools
在kibana所在的服务器上安装nginx服务,利用nginx的转发指令实现。
安装好nginx后,进入nginx配置页面,修改如下:
vim /etc/nginx/conf.d/kiban_auth.conf
server {
          listen 80;
          listen 443 ssl;
          server_name www.wzxmt.com wzxmt.com;
          ssl_certificate /etc/nginx/ssl/wzxmt.crt;
          ssl_certificate_key /etc/nginx/ssl/wzxmt.key;
          ssl_session_timeout 5m;
          return 301 https://www.wzxmt.com$request_uri;
          access_log /var/log/nginx/kiban_auth.log;
          error_log /var/log/nginx/kiban_auth_error.log;
location / {
          root /usr/share/nginx/html;
          index index.html index.htm;
          proxy_set_header Host $host;
          proxy_pass http://127.0.0.1:5601;
          auth_basic "kibana login auth";
          auth_basic_user_file /etc/nginx/Kbn_htpasswd;
     }
}
生成密码文件:
htpasswd -bc /etc/nginx/Kbn_htpasswd wzxmt wzxmt
chmod 400 /etc/nginx/Kbn_htpasswd
chown -R nginx. /etc/nginx/Kbn_htpasswd
启动nginx
nginx
访问我们的web网站www.wzxmt.com,这时候访问是需要验证登录,这样大大加强了,kibana的安全性。
这样,我们的elk集群已经搭建成功!接下来需要在客户端搭建filbeat进行收集日志。
八、使用redis来缓解耦合
Redis 作为一个缓存,能够帮助我们在主节点上屏蔽掉多个从节点之间不同日志文件的差异,负责管理日志端(从节点)的人可以专注于向 Redis 里生产数据,而负责数据分析聚合端的人则可以专注于从 Redis 内消费数据。
下载Redis
https://redis.io 官网下载
wget http://download.redis.io/releases/redis-5.0.5.tar.gz
安装redis
tar xf redis-5.0.5.tar.gz -C /usr/local/src/
cd /usr/local/src/redis-5.0.5
make
mkdir /usr/local/redis/{data,logs} -p
cd src && make install PREFIX=/usr/local/redis
修改环境变量
echo 'export PATH=/usr/local/redis/bin:$PATH' >>/etc/profile
source /etc/profile
修改redis配置
vim /usr/local/redis/redis.conf
port 6379
daemonize yes
bind node01 127.0.0.1
pidfile /usr/local/redis/redis.pid
logfile /usr/local/redis/logs/redis.log
dbfilename dump.rdb
save 900 1
save 300 10
save 60 10000
dir /usr/local/redis/data
启动redis
redis-server /usr/local/redis/redis.conf
将filebeat收集到的日志输出到redis中,只需要配置filebeat.yml
vim /usr/local/filebeat/filebeat.yml
output.redis:
  hosts: ["10.0.0.11:6379"]
  key: "sunline_log"
  data_type: "list"
  db: 1
  timeout: 5

filebeat.config.modules:
  path: ${path.config}/modules.d/*.yml
  reload.enabled: false

setup.template.settings:
  index.number_of_shards: 3

filebeat.inputs:
- type: log
  tags: ["sunline_error"]
  enabled: true
  paths:
    - /home/sunline/adviser/logs/*.log*
  encoding: gbk
  exclude_lines: ['^INFO']
  include_lines: ['ERR','WARN','ERROR','Error']
  multiline.pattern: '^[0-9]{4}-[0-9]{2}-[0-9]{2}'
  multiline.negate: true
  multiline.match: after

- type: log
  tags: ["sunline_info"]
  enabled: true
  paths:
    - /home/sunline/adviser/logs/*.log*
  encoding: gbk
  exclude_lines: ['ERR','WARN','ERROR','Error'
  include_lines: ['^INFO']
  exclude_file: ['err.log']
  multiline.pattern: '^[0-9]{4}-[0-9]{2}-[0-9]{2}'
  multiline.negate: true
  multiline.match: after
启动filebeat
cd /usr/local/filebeat/
nohup ./filebeat -e -c filebeat.yml &
将redis输入到logstash
vim /usr/local/logstash/logstash.conf
input {
    redis {
        host => "node01"
        port => "6379"
        db => "1"
        data_type => "list"
        key => "sunline_log"
    }
}

filter {
    grok {
        match => ["message", "%{TIMESTAMP_ISO8601:timestamp}"] #2019-06-10 16:00:00,063
        remove_field => ["input"]
  }
}

output{
  if "sunline_error" in [tags] {
    elasticsearch {
        hosts => ["node01:9200","node02:9200","node03:9200"]
        index => "sunline_error-%{+YYYY.MM.dd}"
     }
   }
  if "sunline_info" in [tags] {
    elasticsearch {
        hosts => ["node01:9200","node02:9200","node03:9200"]
        index => "sunline_info-%{+YYYY.MM.dd}"
     }
   }
}
启动logstash
cd /usr/local/logstash
nohup bin/logstash -f logstash.conf -r &
通过kibana平台,我们可以看到收集的数据。
九、使用kafka来缓解耦合
当我们的数据量很大时,redis与mq都撑不住时,这时候可以考虑kafka来解决!Kafka是由Apache软件基金会开发的一个开源流处理平台,由Scala和Java编写。Kafka是一种高吞吐量的分布式发布订阅消息系统,它可以处理消费者在网站中的所有动作流数据。 这些数据通常是由于吞吐量的要求而通过处理日志和日志聚合来解决。 对于像Hadoop一样的日志数据和离线分析系统,但又要求实时处理的限制,这是一个可行的解决方案。Kafka的目的是通过Hadoop的并行加载机制来统一线上和离线的消息处理,也是为了通过集群来提供实时的消息。Kafka是一种高吞吐量的分布式发布订阅消息系统:
(1)通过O的磁盘数据结构提供消息的持久化,够保持长时间的稳定性能。
(2)高吞吐量:即使是非常普通的硬件Kafka也可以支持每秒数百万的消息。
(3)支持通过Kafka服务器和消费机集群来分区消息。
(4)支持Hadoop并行数据加载。
Kafka集群持久地保留所有已发布的记录 - 无论它们是否已被消耗 - 使用可配置的保留期。而redis只要被消耗了,数据也就消失了,这一点上,要比redis要安全很多!我们都知道Redis是以key的hash方式来分散对列存储数据的,且Redis作为集群使用时,对应的应用对应一个Redis,在某种程度上会造成数据的倾斜性,从而导致数据的丢失。而从之前我们部署Kafka集群来看,kafka的一个topic(主题),可以有多个partition(副本),而且是均匀的分布在Kafka集群上,这就不会出现redis那样的数据倾斜性。Kafka同时也具备Redis的冗余机制,像Redis集群如果有一台机器宕掉是很有可能造成数据丢失,而Kafka因为是均匀的分布在集群主机上,即使宕掉一台机器,是不会影响使用。同时Kafka作为一个订阅消息系统,还具备每秒百万级别的高吞吐量,持久性的、分布式的特点等。
我们可以使用kafka单点,也可以使用集群,kafka依赖zookeeper集群,这里按照我前面写的博客部署zookeeper3.5.5集群部署即可!然后部署kafka集群,按照我的上篇博客Kafka 集群部署即可;
在搭建好kafka集群后,需要手动创建创建topic,因为默认导入的创建topic只有一个副本,一个分区,我们使用集群,需要设置多个副本与分片
kafka-topics.sh --create --zookeeper node01:2181 --replication-factor 3 --partitions 3 --topic test_info
接下来是要将我们的日志收集到kafka中,客户端我们选择filebeat,具体安装我们前面已经讲过,直接进行配置:
vim /usr/local/filebeat/filebeat-kafka.yml
output.kafka:
  enabled: true
  hosts: ["node01:9092", "node02:9092", "node03:9092"]
  group_id: "logstash-group"
  topic: 'test_info'
  #默认为100000,消息长度过长,会忽略消息
  max_message_bytes: 10000000

filebeat.config.modules:
  path: ${path.config}/modules.d/*.yml
  reload.enabled: false
setup.template.settings:
  index.number_of_shards: 3

filebeat.inputs:
- type: log
  tags: ["ela_error"]
  enabled: true
  paths:
    - /data/elasticsearch/logs/elasticsearch.log
  encoding: gbk
  exclude_lines: ['^INFO']
  include_lines: ['ERR','WARN']
  multiline.pattern: '^[0-9]{4}-[0-9]{2}-[0-9]{2}'
  multiline.negate: true
  multiline.match: after

- type: log
  tags: ["ela_info"]
  enabled: true
  paths:
    - /data/elasticsearch/logs/elasticsearch.log
  exclude_lines: ['ERR','WARN']
  include_lines: ['INFO']
  multiline.pattern: '^[0-9]{4}-[0-9]{2}-[0-9]{2}'
  multiline.negate: true
  multiline.match: after
可以看到我们的数据导入成功
[root@node01 _site]# kafka-topics.sh --list --zookeeper node01:2181
test_info
接下来是把kafka数据导入到es集群,通过logstash过滤将数据导入es集群
vim /usr/local/logstash/logstash_kafak.conf
input {
      kafka {
         bootstrap_servers=> "node01:9092,node02:9092,node03:9092"
         topics =>"test_info"
         #配置的消费者的group名称,因为同一个组内的消费消息不会重复
         group_id => "logstash-group"
         codec => "json"
    }
}

filter {
    grok {
        #解析message的timestamp字段
        match => ["message", "%{TIMESTAMP_ISO8601:timestamp}"] #2019-06-10 16:00:00,063
        remove_field => ["input"]
   }
}

output{
  if "ela_error" in [tags] {
    elasticsearch {
        hosts => ["node01:9200","node02:9200","node03:9200"]
        index => "ela_error-%{+YYYY.MM.dd}"
     }
   }
  if "ela_info" in [tags] {
    elasticsearch {
        hosts => ["node01:9200","node02:9200","node03:9200"]
        index => "ela_info-%{+YYYY.MM.dd}"
     }
   }
}
当我们从kafka读取消息的时候,消息体是通过message字段来进行传递的,所以message是一个字符串,但是我们的es索引模板可能会非常复杂,所以我们需要对其进行json解析后,再交给es。否则es收到的之后一个message字段。
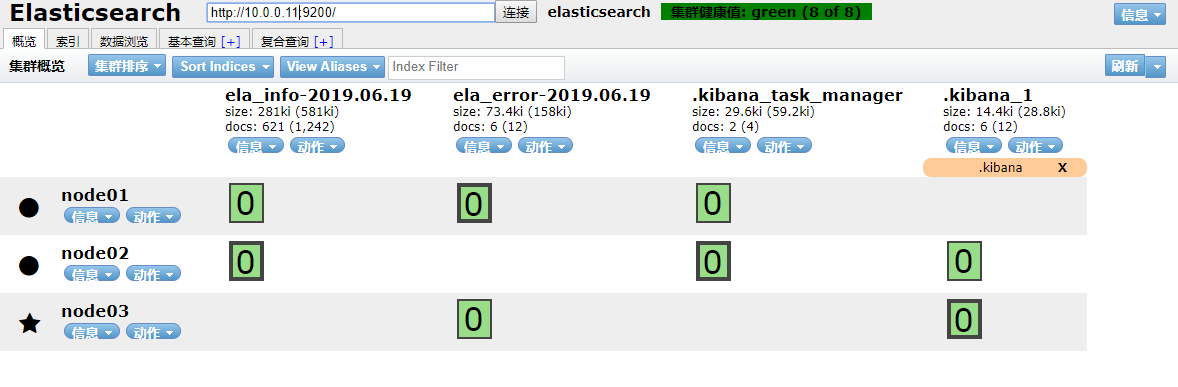
可以看到已经采集到数据。
随着分片的逐渐增多,数据增大,查询效率就会降低,如果不删除数据,将会导致ES存储的数据越来越大,甚至无法写入新的数据,这时需要我们清楚不必要的历史数据。可以在head插件上删除,只不过这种方式比较麻烦,这时候我们可以通过
curl -XDELETE http://localhost:9200/customer?pretty
这条命令来实现脚本化来定时删除数据,脚本如下:
vim es-index-clear.sh
#全部删除:
#!/bin/bash
date_index='30 day ago'
nodes=`ip a s eth0|awk -F "[ /]+" 'NR==3{print $3}'`

del_index() {
    date1=$1
    date2=`date -d "${date_index}" +"%Y.%m.%d"`

    t1=`echo ${date1}|sed 's/.//g'`
    t2=`echo ${date2}|sed 's/.//g'`

    if [ $t1 -le $t2 ]; then
        echo "indexs时间${t1}早于${t2},进行索引删除!"
        curl -XDELETE http://${nodes}:9200/*$1
    fi
}

curl -XGET http://${nodes}:9200/_cat/indices|sed -rn "s#(.*)([0-9]{4}(.([0-9]){2}){2})(.*)#2#gp"|uniq|sort -nr|while read LINE
do
    del_index $LINE
done
#排除某分片:
#!/bin/bash
#适用于分片格式:test-2019.05.28
date_index='0 day ago'
nodes=`ip a s eth0|awk -F "[ /]+" 'NR==3{print $3}'`
exclude_index=test  # a|b|c排除多个分片格式

del_index() {
    date1=$1
    date2=`date -d "${date_index}" +"%Y.%m.%d"`

    t1=`echo ${date1}|sed 's/.//g'`
    t2=`echo ${date2}|sed 's/.//g'`

    if [ $t1 -le $t2 ]; then
        #获取分片名称
        curl -XGET http://${nodes}:9200/_cat/indices|grep "-2"|grep "$1"|grep -v "${exclude_index}"|awk '{print $3}'|sed -r "s/(.*)(-20.*)/1/g"|while read line
        do
            echo "${line}时间${t1}早于${t2},进行索引删除!"
            #删除分片
            curl -XDELETE http://${nodes}:9200/${line}-$1 &>/dev/null
        done
    fi
}

#获取分片时间
curl -XGET http://${nodes}:9200/_cat/indices|sed -rn "s#(.*)([0-9]{4}(.([0-9]){2}){2})(.*)#2#gp"|uniq|sort -nr|while read LINE
do
    del_index $LINE 2>/dev/null
done
脚本添加执行权限
chmod +x /usr/local/elasticsearch/scripts/es-index-clear.sh
crontab -e添加定时任务:
0 1 1 * * /usr/local/elasticsearch/scripts/es-index-clear.sh
表示在每个月1号的凌晨一点进行清除索引
最后再附上es启动脚本:
#!/bin/bash
#################################################
#    File Name: es_start.sh
#       Author: lxw
#         Mail: 1451343603@qq.com
#     Function:
# Created Time: Thu Oct 24 10:12:24 CST 2019
#################################################
es_work=/usr/local/elasticsearch
es_pid=`ps -aux|grep 'elasticsearch/lib'|grep -v 'grep'|awk '{print $2}'`

es(){
    RETVAL=$?
    if [ $RETVAL -eq 0 ];then
        echo "Elasticsearch $1 successed!"
    else
        echo "Elasticsearch $1 failsed!"
        exit
    fi
}

start_m(){
    su - elasticsearch &>/dev/null<<-EOF
    cd $es_work
    bin/elasticsearch -d &>/dev/null
    EOF
}

es_start(){
    if [ ! -z $es_pid ];then
        echo "Elasticsearch is running!"
    else
        start_m
        es start
    fi
}

es_stop(){
    if [ ! -z $es_pid ];then
        kill $es_pid
        es stop
    else
        echo "Elasticsearch is stoped!"
    fi
}

es_restart(){
    if [ ! -z $es_pid ];then
        kill $es_pid
        es stop
        sleep 2
        start_m
        es start
    else
        echo "Elasticsearch is stoped!"
        sleep 2
        start_m
        es start
    fi
}

case $1 in
    start)
        es_start
        ;;
    stop)
        es_stop
        ;;
    restart)
        es_restart
        ;;
    *)
        echo $"USAGE: $0 {start|stop|restart}"
esac
exit $?