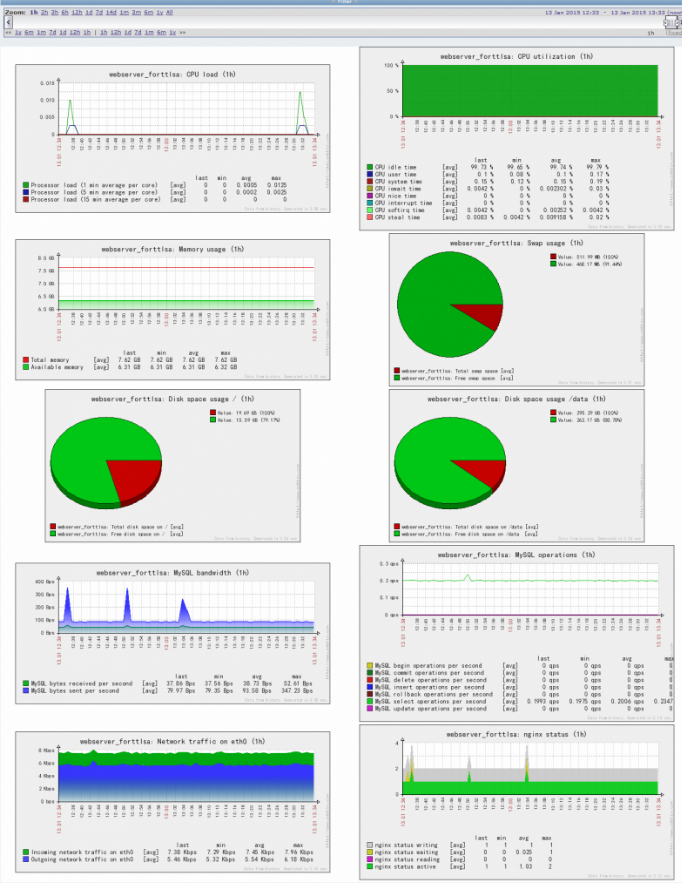
screen翻译成中文为“屏幕”,在超市、单位等等地方都比较常见到监控视频,视频上有多块小视频,实际上zabbix screen和这个功能类似。你可以设置多个screen,每个screen可以显示特定信息,例如某台主机的cpu、内存、硬盘、网卡流量使用状况,也可以显示text文本,甚至能够嵌入其他screen。
不明白?看图
zabbix screen支持的元素类型
simple graphs
user-defined custom graphs
maps
other screens
plain text information
server information (overview)
hosts information (overview)
trigger information (overview)
host/hostgroup issues (status of triggers)
system status
data overview
clock
history of events
history of actions
URL (data taken from another location)
一共15种,最常用的是simple graphs,想对这些有更大的一个了解,请看后续章节,会有一个专门的演示
创建screen
点击configuration--screen--create screen,输入如下信息:
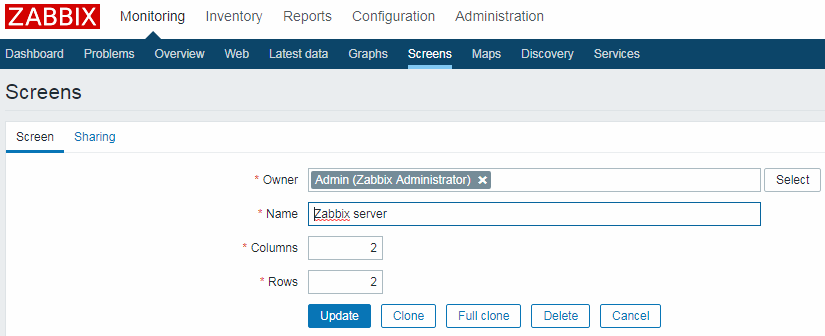
Name: screen名称,可以用中文
Columns:列个数
Rows:行个数
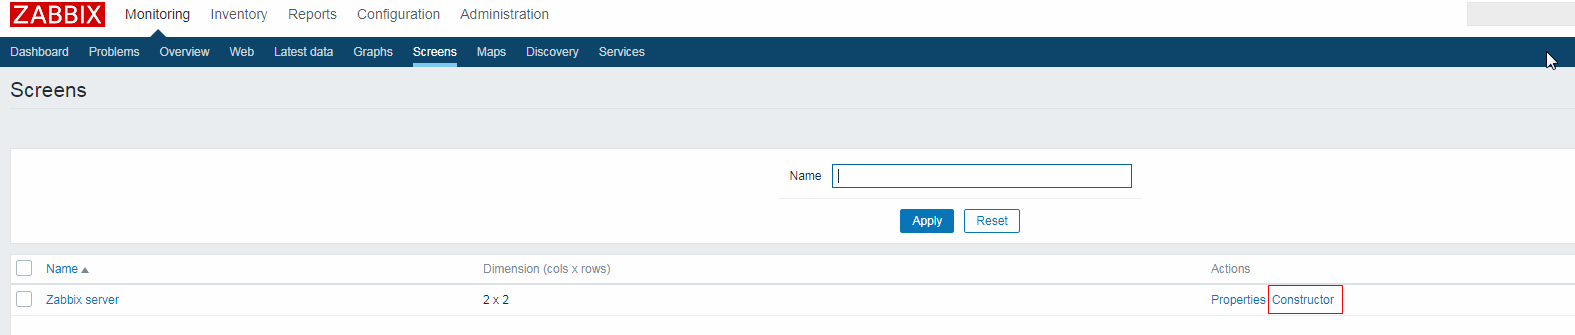

说明:
1. change:可添加元素,例如图表、map、text等等元素
2. 加号:相应增加行或者列
3.减号:响应删除行或者列
点击Change,如下图:
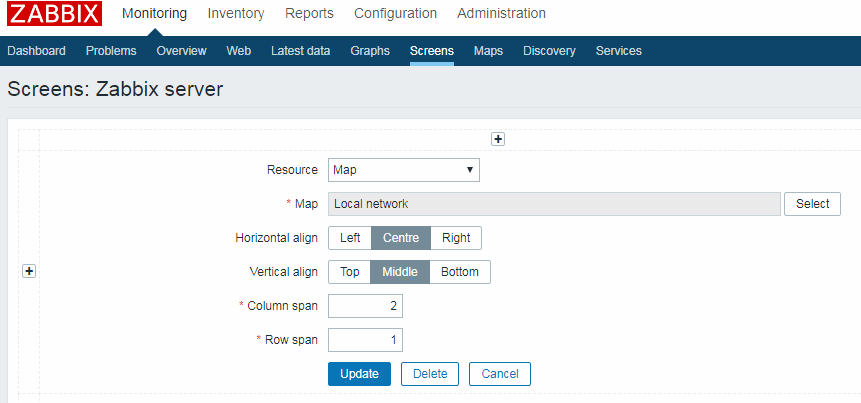
参数说明
| 参数 | 说明 |
| Resource | simple graphs user-defined custom graphs maps other screens plain text information server information (overview) hosts information (overview) trigger information (overview) host/hostgroup issues (status of triggers) system status data overview clock history of events history of actions URL (data taken from another location) |
| Horizontal align | 水平对齐方式: Center(居中) Left(左对齐) Right(右对齐) |
| Vertical align | 垂直对齐方式: Middle(中间) Top(顶部) Bottom(底部) |
| Column span | 列跨度,当前元素占用几个列 |
| Row span | 行跨度,当前元素占用几个行 |
| Dynamic elements | 动态元素(即screen中可按不同主机分类显示),有点不好理解。如果这个screen有一个元素选中了Dynamic elements,在monitoring->screen,screen下拉列表选择这个screen,会出现hosts下拉表,选中一个hosts,如果当前元素不属于这个主机,那么不会显示,如果属于这个主机便会显示。 |
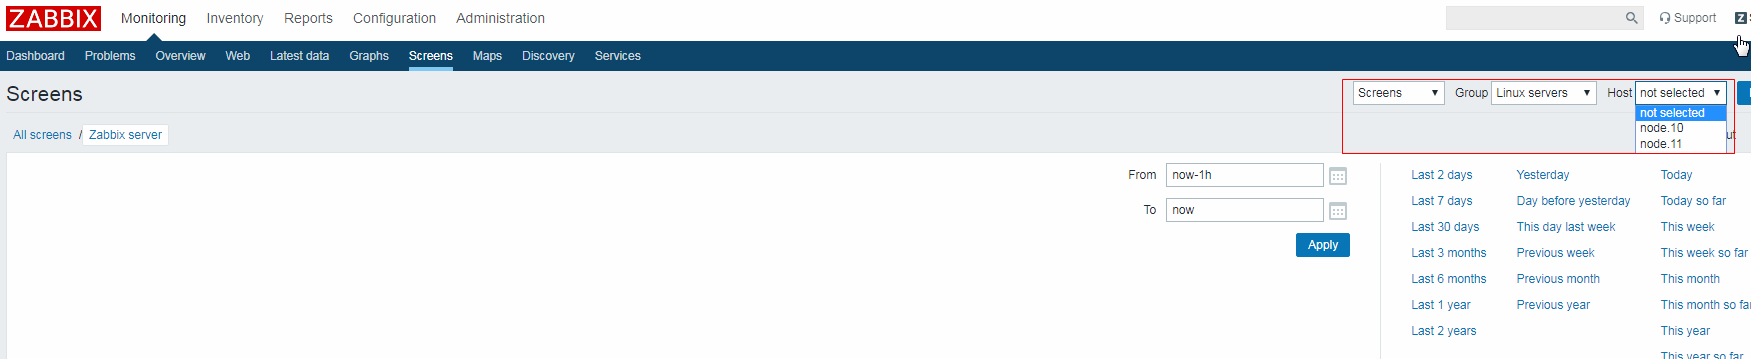
多了两个下拉列表,可以选择主机
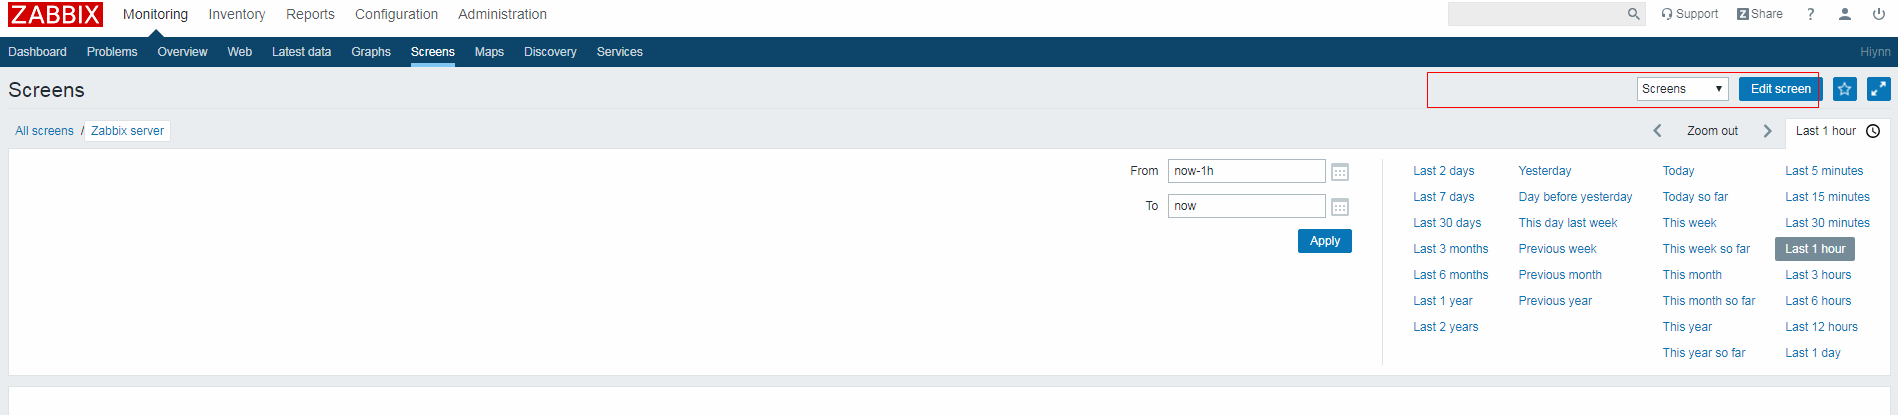
普通的screen
动态元素支持的类型:Graphs (custom graphs)、Simple graphs、Plain text