Prometheus官网下载地址:https://prometheus.io/download/,此下载地址一般只有最新版,如果想要下载其他版本,需要到github上
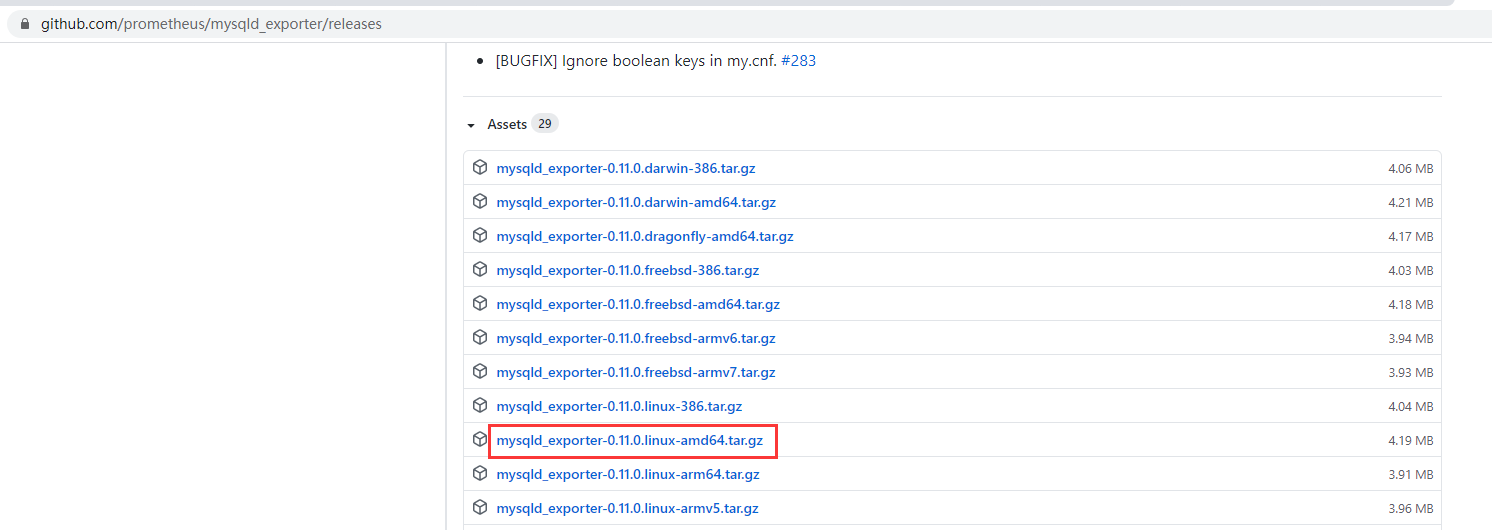
Mysqld_exporter的github下载地址:https://github.com/prometheus/mysqld_exporter/releases,此处需要下载11版本(必须是11版本,否则后面grafana无法展示图形)
Mysqld_exporter 11版本下载地址:https://github.com/prometheus/mysqld_exporter/releases/download/v0.11.0/mysqld_exporter-0.11.0.linux-amd64.tar.gz
百度网盘地址:
链接:https://pan.baidu.com/s/1MK8dWdhBxwl9pCwXRLvqJw
提取码:brkn
我这里是centOS系统,如果是其它系统则需要根据系统相关信息
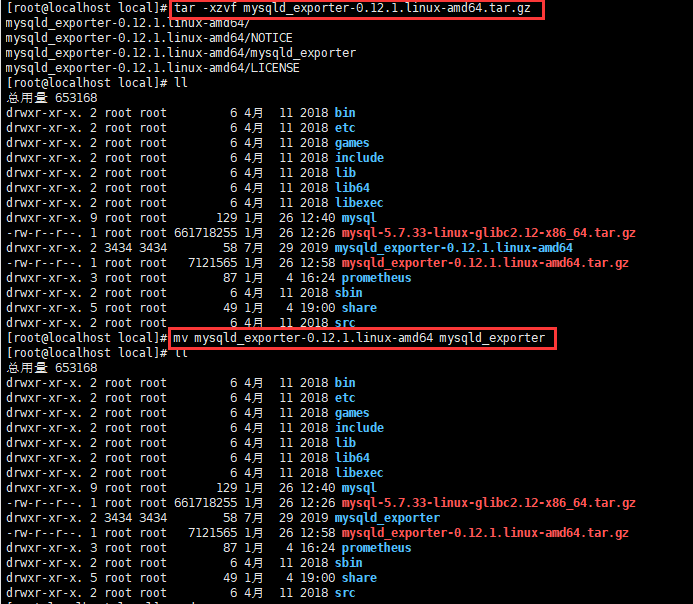
#定位到安装目录下
cd /usr/local
#将下载到本地的文件上传到Linux服务器
rz
#解压文件
tar -xzvf mysqld_exporter-0.11.1.linux-amd64.tar.gz
#将文件目录名改为mysqld_exporter
mv mysqld_exporter-0.11.1.linux-amd64 mysqld_exporter
mysqld_exporter需要连接Mysql,首先为它创建用户并赋予所需要的权限:
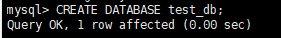
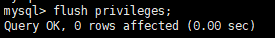
#创建exporter用户 grant all privileges on *.* to 'user'@'%' identified by '123456'
GRANT ALL ON *.* TO 'exporter'@'localhost' identified by '123456';
#创建数据库
CREATE DATABASE test_db;
#赋予查询权限
GRANT SELECT ON test_db.* TO 'exporter'@'localhost';
#刷新权限
flush privileges;


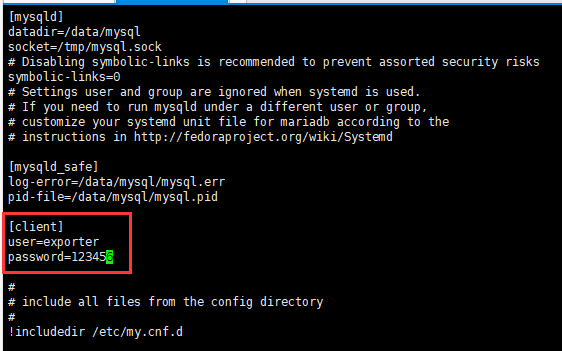
创建.my.cnf文件:
[client]
user=exporter
password=123456
启动mysqld_exporter
启动方式一:
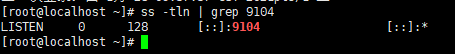
#启动mysqld_exporter
./mysqld_exporter --config.my-cnf=/etc/my.cnf
#查看端口开启清空
ss -tln | grep 9104

启动常用参数
#启动常用参数
# 选择采集innodb
--collect.info_schema.innodb_cmp
# innodb存储引擎状态
--collect.engine_innodb_status
# 指定配置文件
--config.my-cnf="/etc/my.cnf"
添加系统服务:vi /usr/lib/systemd/system/mysql_exporter.service
[Unit]
Description=https://prometheus.io

[Service]
Restart=on-failure
ExecStart=/usr/local/mysql_exporter/mysqld_exporter --config.my-cnf=/etc/my.cnf

[Install]
WantedBy=multi-user.target
启动添加后的系统服务
systemctl daemon-reload
systemctl restart mysql_exporter.service
启动日志可以在/var/log/messages中查看
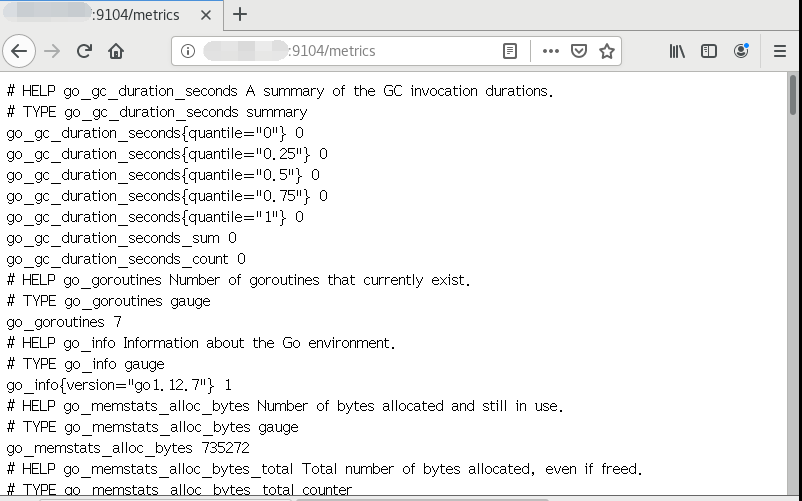
查看MySQLd exporter捕获mysql数据
使用浏览器打开服务器IP:9104,然后点击Metrics,显示如下图则表示数据获取成功

配置Prometheus监控设置:
scrape_configs:
  # 添加作业并命名
  - job_name: 'mysql'
    # 静态添加node
    static_configs:
    # 指定监控端
    - targets: ['数据库服务器IP:9104']
启动Prometheus,
#定位到prometheus安装目录
cd /usr/local/prometheus/prometheus-2.23.0.linux-amd64
#执行启动
./prometheus --config.file=prometheus.yml &
启动成功后访问prometheus,服务器IP地址:9090,如下图,9104就是监控到的mysql_reporter

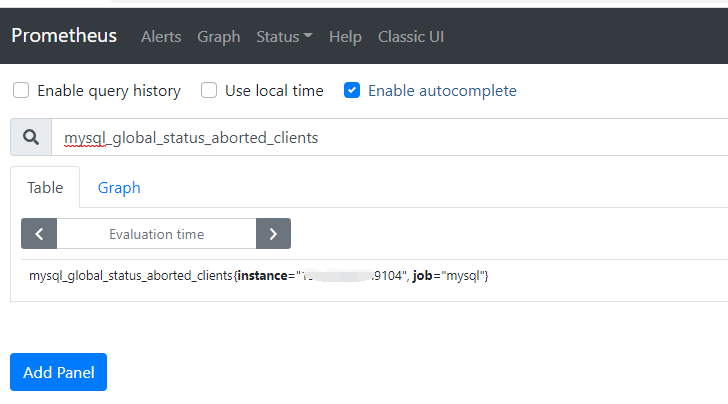
使用promSQL查看Mysql监控信息
mysql_global_status_aborted_clients
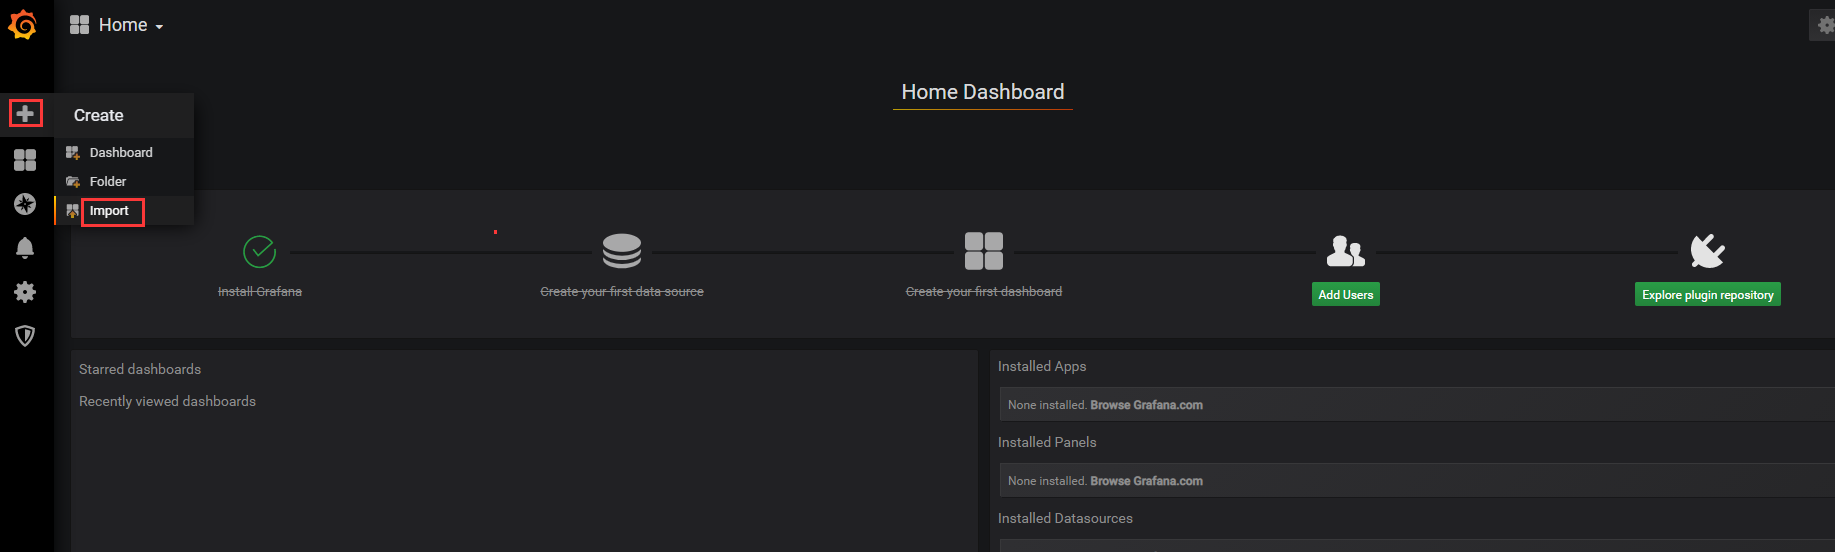
监控可视化
配置Grafana
启动grafana:
service grafana-server start

执行ps -ef | grep grafana,查看是否启动成功

浏览器中输入http://安装Grafana服务器IP:3000/,然后登陆grafana


遇到的问题:
问题1:执行systemctl restart mysql_exporter.service时提示:
Failed to restart mysql_exporter.service: Unit is not loaded properly: Invalid argument.
See system logs and 'systemctl status mysql_exporter.service' for details.

查看系统日志/var/log/messages,显示:mysql_exporter.service lacks both ExecStart= and ExecStop= setting
于是修改mysql_exporter.service,将ExecStart拆分到第二行,保存后再执行systemctl restart mysql_exporter.service,执行成功
问题2:访问prometheus,mysql_reporter的状态是down的状态,提示:Get "http://数据库IP:9104/metrics": context deadline exceeded
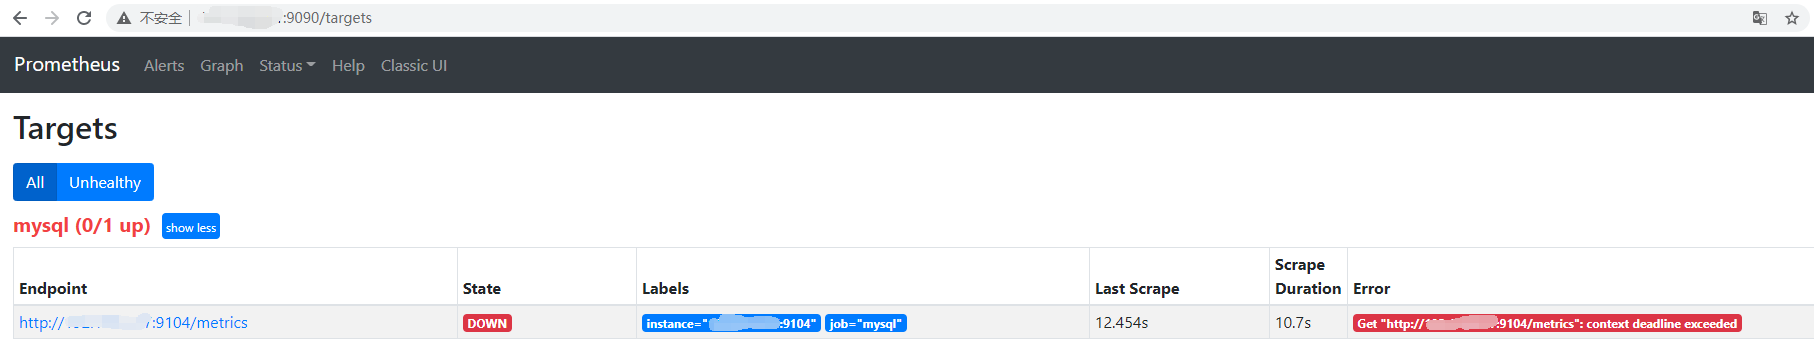
于是访问数据库9104端口,访问地址:数据库IP:9104,显示无法访问,查看服务器端口9104是开启状态

查看防火墙状态:firewall-cmd --state,显示是running
于是关闭防火墙:systemctl stop firewalld.service,然后查看防火墙状态:firewall-cmd --state

刷新Prometheus界面,显示mysql_reporter是up状态,则表示监控成功

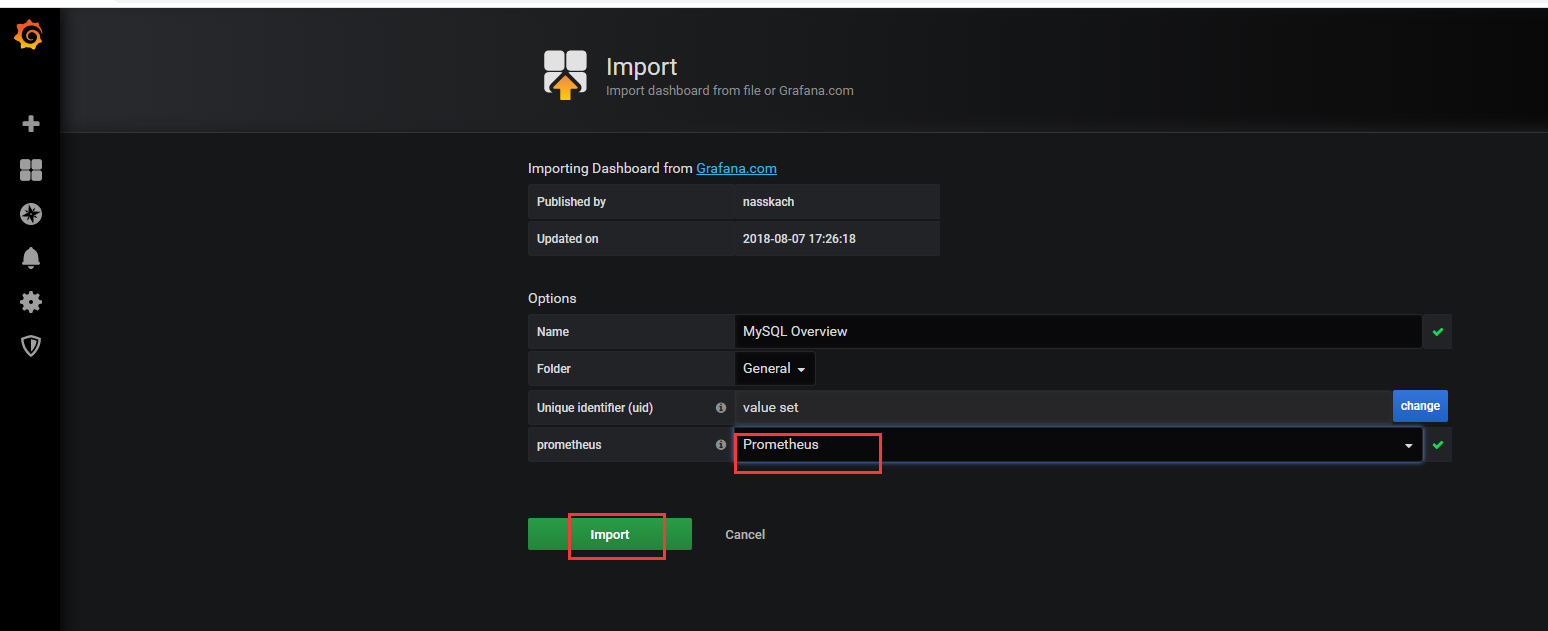
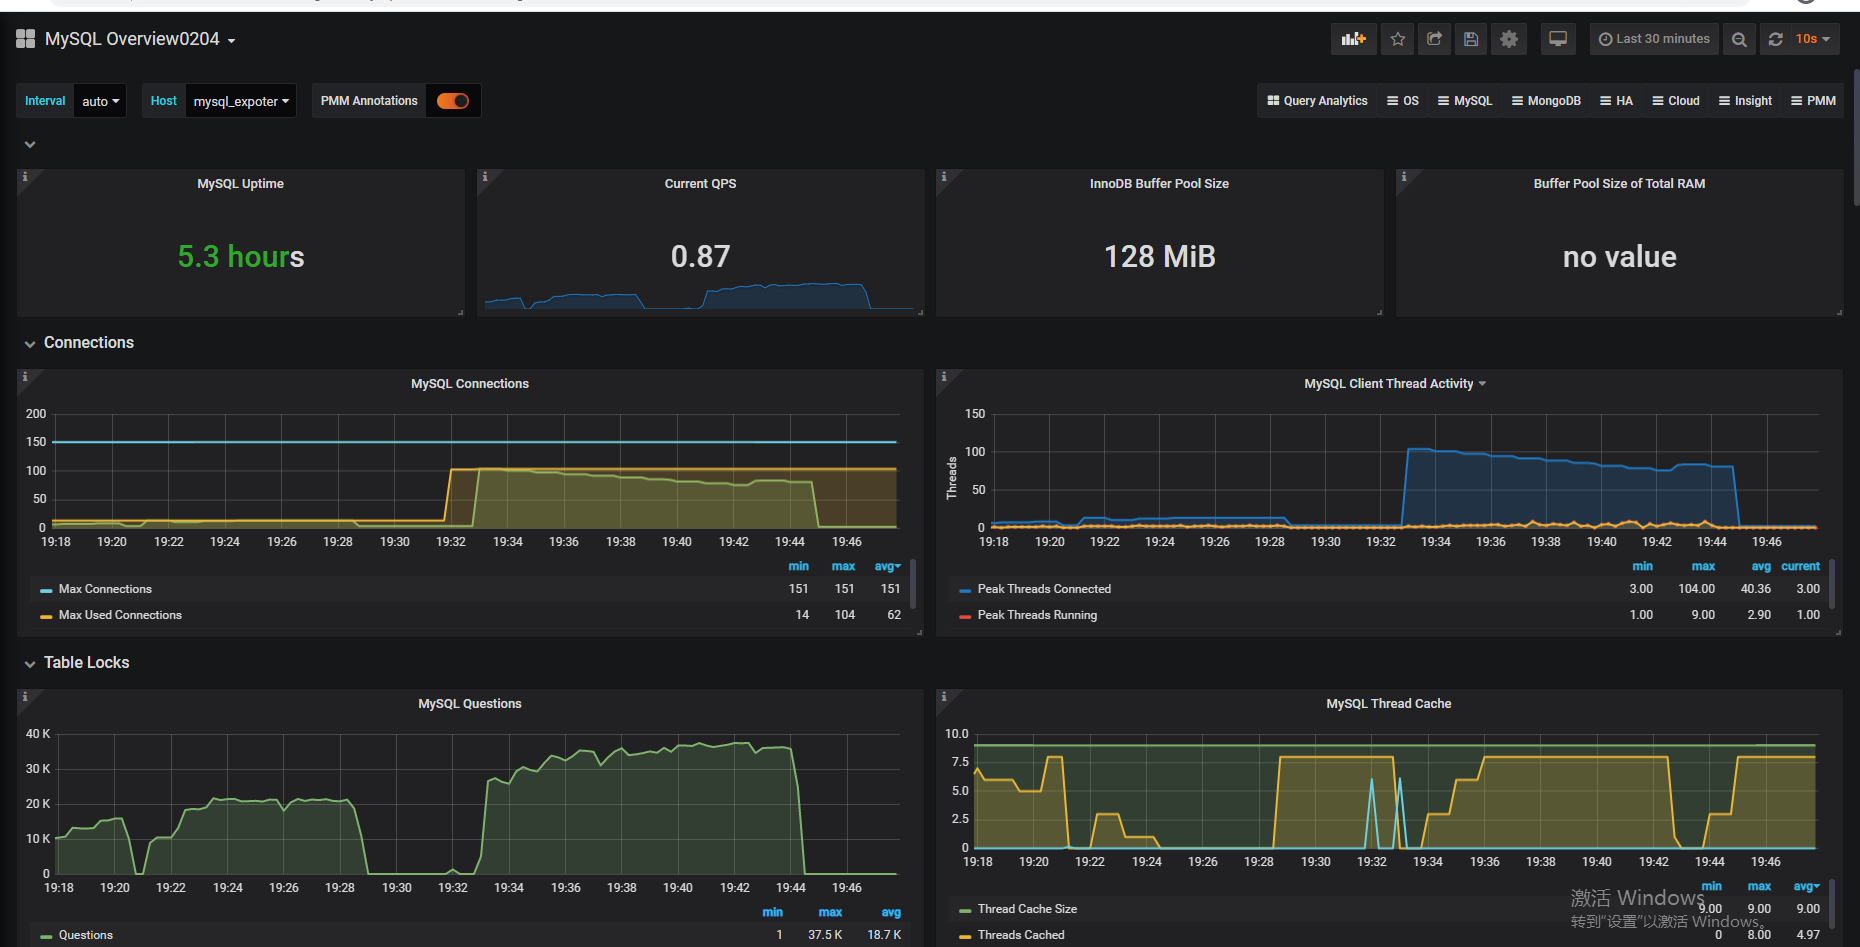
问题3:Grafana导入mysql模板后,未获取任何数据

原因:是mysqld_exporter版本不匹配,和prometheus.yml文件未配置labels
解决办法:将Mysqld_expoter版本使用11版本,只需解压覆盖之前的12版本即可,然后配置prometheus.yml,如下图:

保存重启prometheus即可