##数据获取
x1=round(runif(100,min=80,max=100))
x2=round(rnorm(100,mean=80, sd=7))
x3=round(rnorm(100,mean=80,sd=18))
x3[which(x3>100)]=100
num=seq(2005138101,length=100)
x=data.frame(num,x1,x2,x3)
write.table(x, "grade.txt")
##数据分析
y=read.table("grade.txt")
mean(y)
colMeans(y)
colMeans(y)(c("x1","x2","x3"))
#//2代表按列取平均值
apply(x, 2, mean)
apply(x, 2, max)
apply(x, 2, min)
apply(x[c("x1","x2","x3")], 2, sum)
#常用分布函数
均匀分布:runif()
正态分布:rnorm()
二项式分布:rbinom()
gamma分布:rgamma()
泊松分布:rpois()
指数分布:rexp()
几何分布:rgeom()
> which.max(apply(x[c("x1","x2","x3")], 1, sum)) 49
> x$num[which.max(apply(x[c("x1","x2","x3")], 1, sum))] [1] 2005138149
> hist(x$x1)
> plot(x$x1,x$x2)
> table(x$x1)
80 81 82 83 84 85 86 87 88 89 90 91 92 93 95 96 97 98 99 100 2 3 4 3 8 3 6 6 6 7 4 6 4 8 8 3 5 6 6 2
> barplot(table(x$x1))
> pie(table(x$x2))
> boxplot(x$x1, x$x2, x$x3)
> boxplot(x[2:4], col=c("red", "blue", "green"), notch=T)
> stars(x[c("x1","x2","x3")])
> stars(x[c("x1","x2","x3")],full=T, draw.segment=T)
> faces(x[c("x1","x2","x3")])
> stem(x$x1)
The decimal point is at the |
80 | 00000 82 | 0000000 84 | 00000000000 86 | 000000000000 88 | 0000000000000 90 | 0000000000 92 | 000000000000 94 | 00000000 96 | 00000000 98 | 000000000000 100 | 00
> stem(x$x2, scale = 1, width = 80, atom = 1e-08)
The decimal point is 1 digit(s) to the right of the |
6 | 23 6 | 7788889 7 | 00001222333444444 7 | 55666677777788888999 8 | 0000000000111122233333344444 8 | 5566666677778999 9 | 001112234 9 | 5
> stem(x$x3, scale = 1, width = 80, atom = 1e-08)
The decimal point is 1 digit(s) to the right of the |
3 | 9 4 | 5 | 0022346788 6 | 1112233344555667789 7 | 022223344444555667889 8 | 0122333444455677999 9 | 000112223345666777889 10 | 000000000
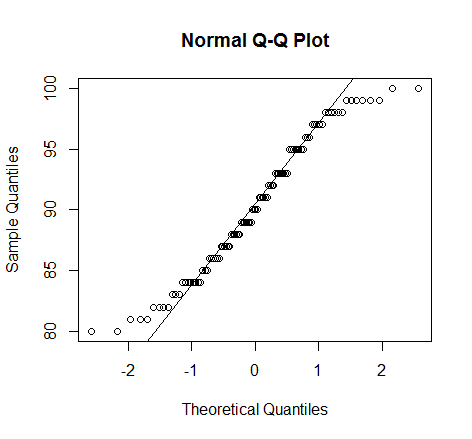
> qqnorm(x1) > qqline(x1)
> qqnorm(x2)
> qqline(x2)