import numpy as np
import matplotlib.pyplot as plt
%matplotlib inline
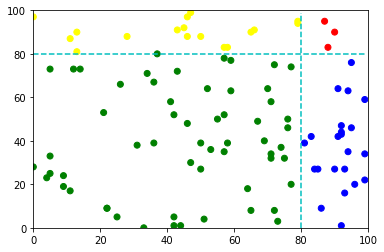
x2 = list(map(int, np.random.random_sample(100) * 100))
y2 = list(map(int, np.random.random_sample(100) * 100))
split_x = split_y = 80
colors = []
for x, y in zip(x2, y2):
if x > split_x:
if y > split_y: # 第一象限
colors.append('red')
else: # 第四象限
colors.append('blue')
else:
if y > split_y: # 第二象限
colors.append('yellow')
else: # 第三象限
colors.append('green')
plt.plot([split_y]*100, 'c--') # 添加横向分隔线
plt.plot([split_x]*100, list(range(0, 100)), 'c--') # 添加纵向分隔线
plt.scatter(x2, y2, c=colors)
plt.xlim([0, 100])
plt.ylim([0, 100])
plt.show()
效果图: