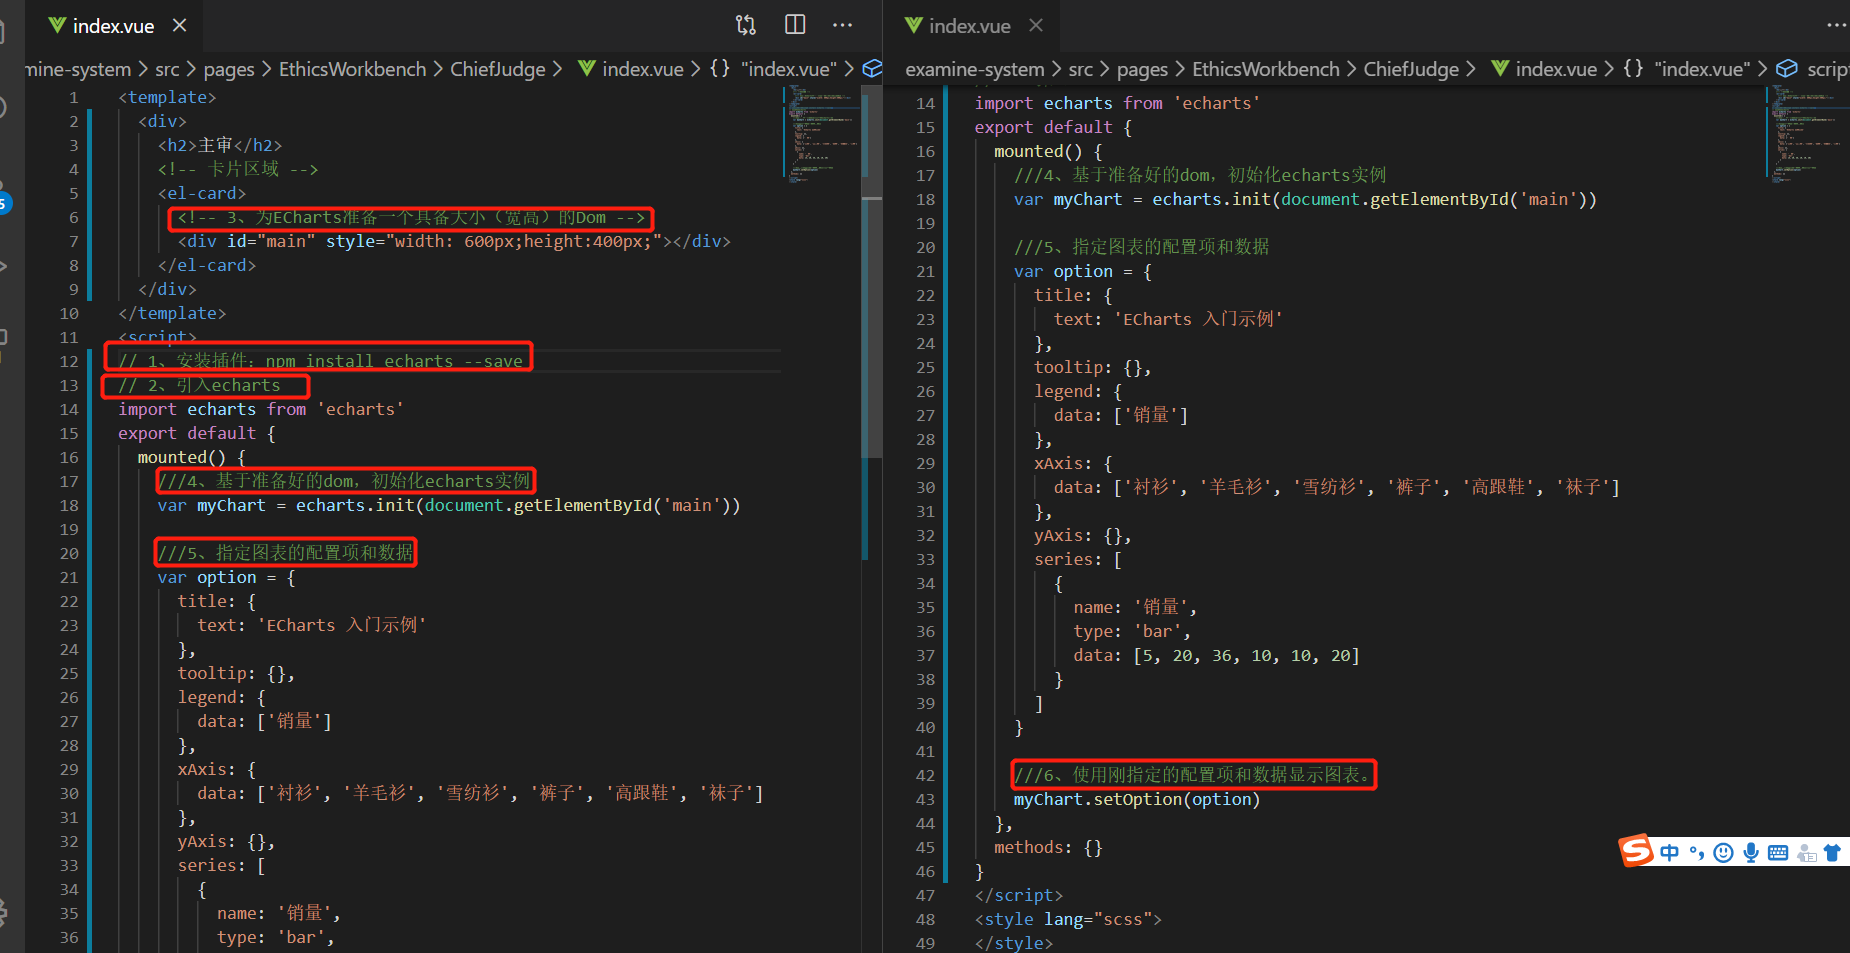
1、安装插件:npm install echarts --save
2、引入echarts
import echarts from 'echarts'
3、为ECharts准备一个具备大小(宽高)的Dom
<div id="main" style=" 600px;height:400px;"></div>
4、基于准备好的dom,初始化echarts实例
var myChart = echarts.init(document.getElementById('main'))
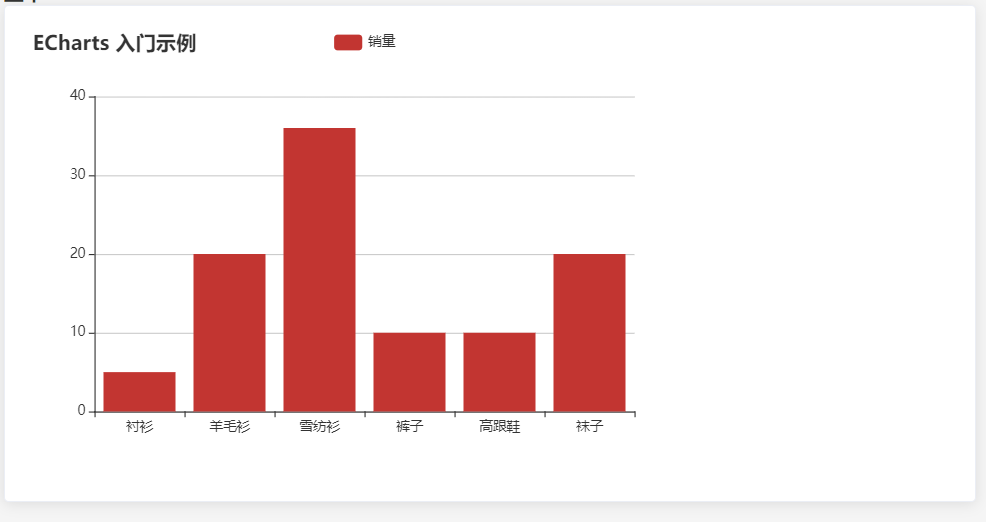
5、指定图表的配置项和数据
    var option = {
      title: {
        text: 'ECharts 入门示例'
      },
      tooltip: {},
      legend: {
        data: ['销量']
      },
      xAxis: {
        data: ['衬衫', '羊毛衫', '雪纺衫', '裤子', '高跟鞋', '袜子']
      },
      yAxis: {},
      series: [
        {
          name: '销量',
          type: 'bar',
          data: [5, 20, 36, 10, 10, 20]
        }
      ]
    }
6、使用刚指定的配置项和数据显示图表
myChart.setOption(option)