用法
jmeter -n -t HTTPRequesttest.jmx -l testHistory/testResult.jtl -e -o testHistory/testReport
参数说明
-n :以非GUI形式运行Jmeter
-t :source.jmx 脚本路径
-l :运行结果保存路径(.jtl),此文件必须不存在
-e :在脚本运行结束后生成html报告
-o :保存html报告的地址, 此文件以及文件目录必须不存在
实时查看压测结果
配置
jmeter命令行下,也可以实时查看压测结果,只需要修改配置文件bin目录下jmeter.properties。
# Summariser - Generate Summary Results - configuration (mainly applies to non-GUI mode)
#---------------------------------------------------------------------------
#
# Define the following property to automatically start a summariser with that name
# (applies to non-GUI mode only)
# summariser.name=summary
#
# interval between summaries (in seconds) default 30 seconds
# summariser.interval=30  //这个表示统计频率
#
# Write messages to log file
# summariser.log=true
#
# Write messages to System.out
# summariser.out=true //是否将统计结果输出到控制台
结果输出
Creating summariser <summary>
Created the tree successfully using HTTPRequesttest.jmx
Starting standalone test @ Sat Jun 27 16:15:48 CST 2020 (1593245748891)
Waiting for possible Shutdown/StopTestNow/HeapDump/ThreadDump message on port 4445
summary =    500 in 00:00:03 =  157.7/s Avg:  1601 Min:   261 Max:  2796 Err:     0 (0.00%)
Tidying up ...    @ Sat Jun 27 16:15:52 CST 2020 (1593245752465)
... end of run
html测试报告
测试结束后,我们在我们自己指定的文件目录下可以看到生成的html报告相关的文件,报告内容如下
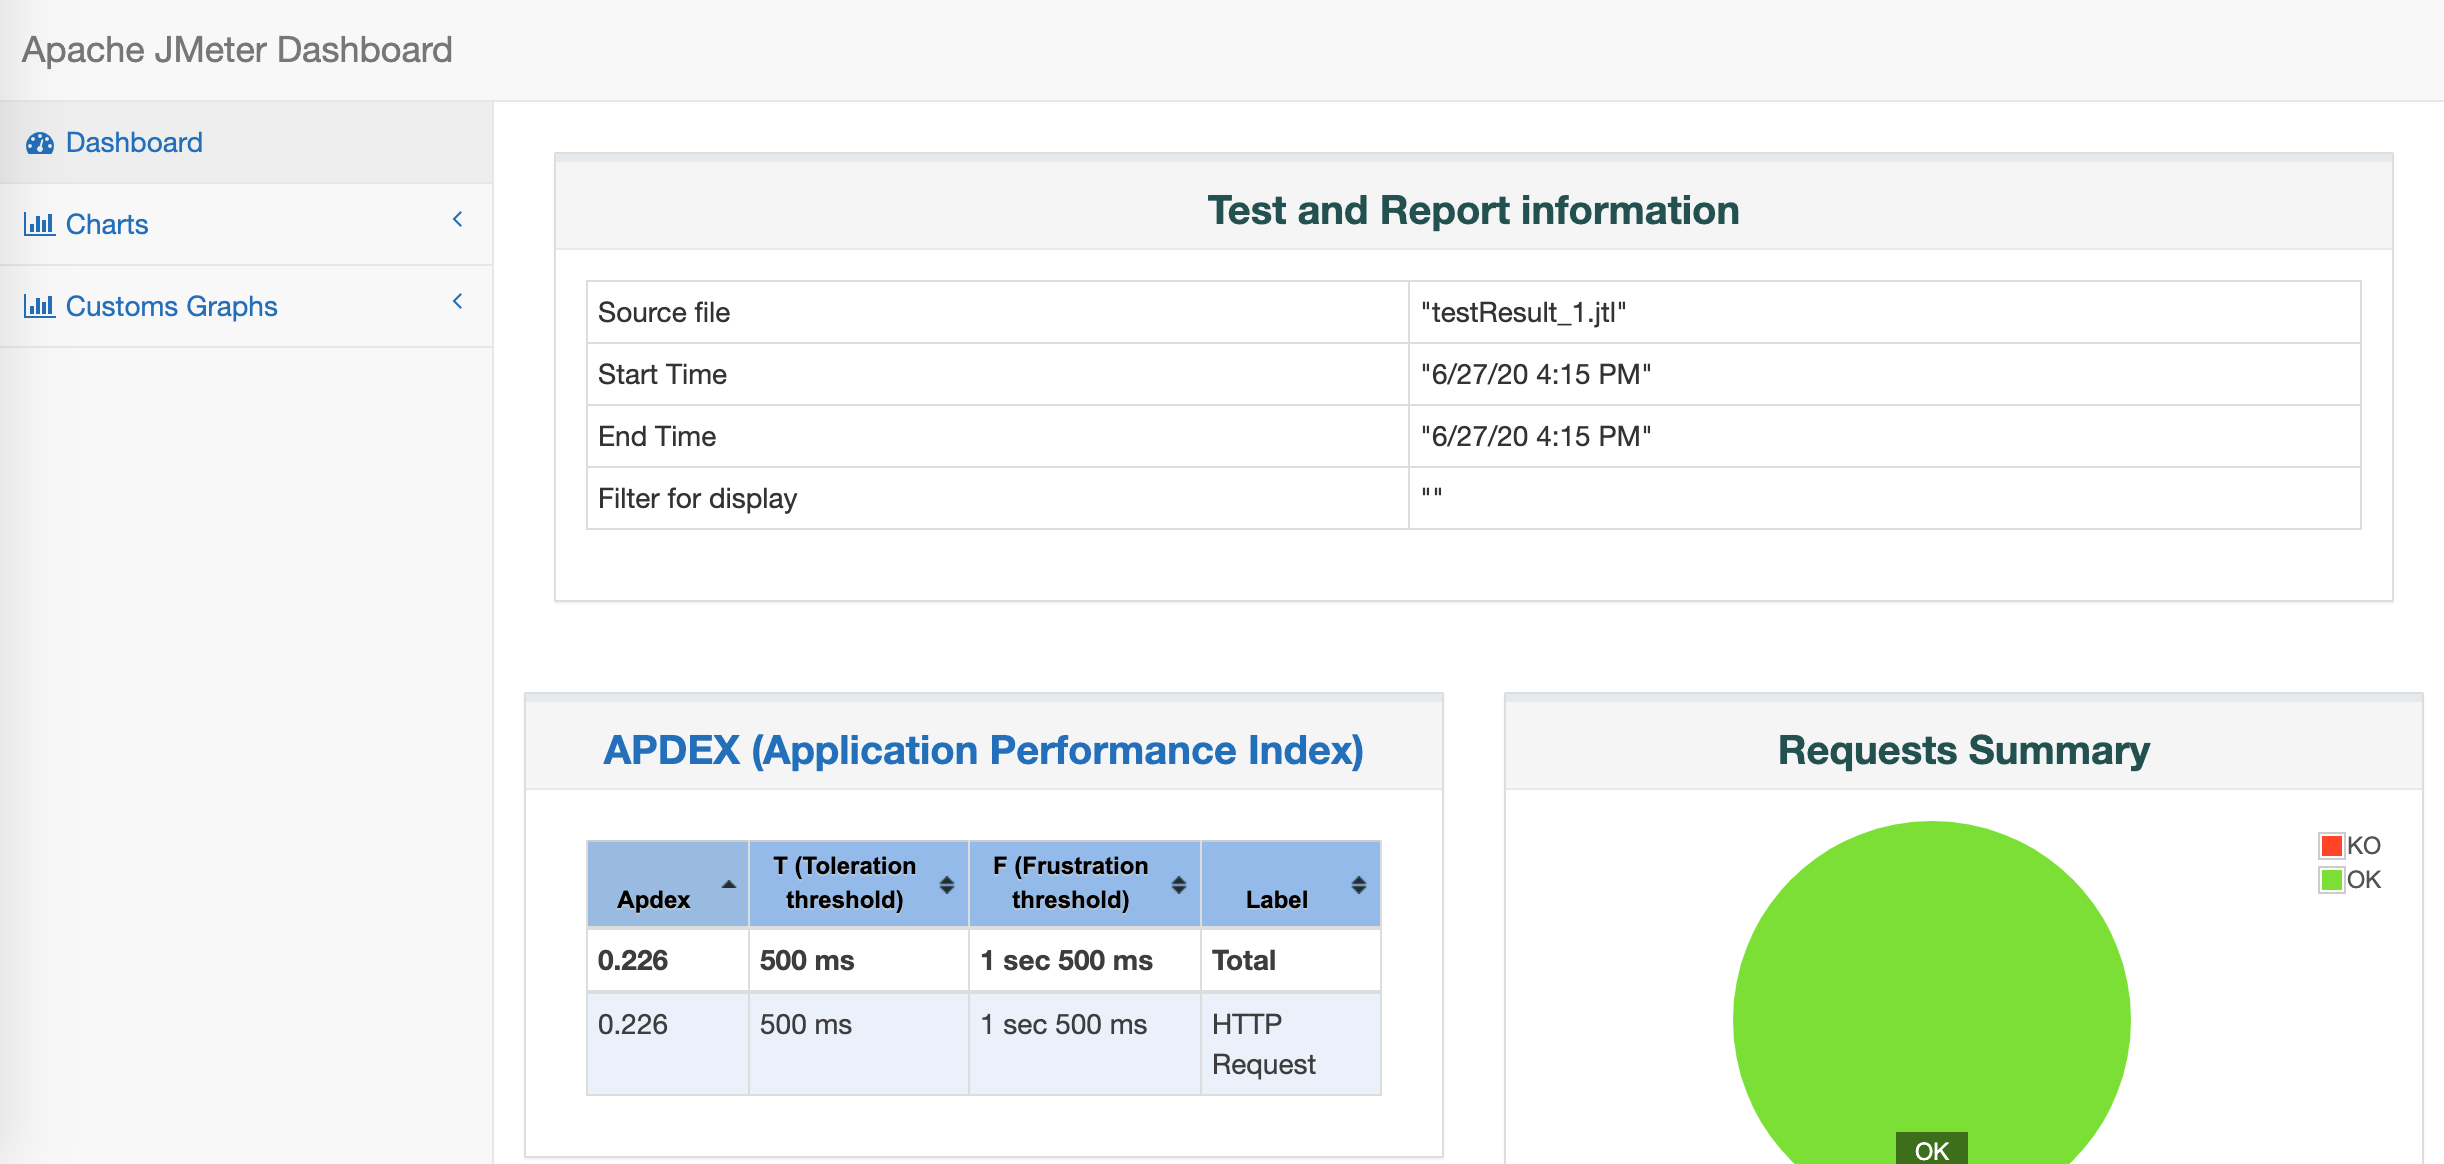
Dashboard
Test and Report informations
测试和报告信息: 测试结果保存文件/测试开始时间/测试结束时间/展示过滤器。
APDEX(Application Performance Index)
应用程序性能满意度的标准,范围在 0-1之间,1表示达到所有用户均满意,可以在配置文件设置
Requests Summary: 请求的通过率(OK)与失败率(KO),百分比显示。
Statistics: 数据分析,基本将 Summary Report 和 Aggrerate Report 的结果合并。
Errors: 错误情况,依据不同的错误类型,将所有错误结果展示。
Charts
用图表的形式展示测试数据,让测试报告更加 直观。
特点:
将测试过程中 经常使用的数据,用图表的形式展示,让测试结果更加直观
每个图表数据,有两种展示形式。
支持请求样例过滤显示
支持导出 PNG图片格式
Over Time
Response Times Over Time: 响应时间
Bytes Throughput Over Time: 字节 接收/发送的数量
Latencies Over Time: 延迟时间
Throughput
Hits Per Second: 每秒点击率
Codes Per Second: 每秒状态码数量
Transactions Per Second: 每秒事务量
Response Time Vs Request: 响应时间点请求的 成功/失败数
Latency Vs Request: 延迟时间点请求的 成功/失败数
Response Times
Response Time Percentiles: 响应时间百分比
Active Threads Over Time: 激活线程数
Time Vs Threads: 测试过程中的线程数时续图
Response Time Distribution: 响应时间分布