-
一、Zabbix环境准备
[root@linux-node1 ~]#  cat /etc/redhat-release
CentOS Linux release 7.4.1708 (Core)
[root@linux-node1 ~]#  uname -r
3.10.0-693.5.2.el7.x86_64
[root@linux-node1 ~]# getenforce
Disabled
[root@linux-node1 ~]#  systemctl stop firewalld
Failed to stop firewalld.service: Unit firewalld.service not loaded.
[root@linux-node1 ~]#  ifconfig eth0|awk -F '[ :]+' 'NR==2{print $3}'
192.168.56.11
[root@linux-node1 ~]# hostname
linux-node1
[root@linux-node1 ~]# yum install -y ntpdate
[root@linux-node1 ~]# ntpdate time1.aliyun.com
[root@linux-node1 ~]# crontab -e
*/5 * * * * /usr/sbin/ntpdate time1.aliyun.com &>/dev/null
-
二、Zabbix安装
Zabbix存储配置包以及yum配置文件

[root@linux-node1 ~]# rpm -ivh http://mirrors.aliyun.com/zabbix/zabbix/3.0/rhel/7/x86_64/zabbix-release-3.0-1.el7.noarch.rpm
[root@linux-node1 ~]# yum list |grep zabbix

Zabbix程序包安装,以及MySQL、Zabbix-agent
[root@linux-node1 ~]# yum install -y zabbix-server-mysql zabbix-web-mysql mariadb-server zabbix-agent
-
三、初始化数据库
创建Zabbix数据库以及用户
[root@linux-node1 ~]# systemctl start mariadb
[root@linux-node1 ~]# mysql_secure_installation
NOTE: RUNNING ALL PARTS OF THIS SCRIPT IS RECOMMENDED FOR ALL MariaDB
      SERVERS IN PRODUCTION USE!  PLEASE READ EACH STEP CAREFULLY!
In order to log into MariaDB to secure it, we'll need the current
password for the root user.  If you've just installed MariaDB, and
you haven't set the root password yet, the password will be blank,
so you should just press enter here.
Enter current password for root (enter for none):
OK, successfully used password, moving on...
Setting the root password ensures that nobody can log into the MariaDB
root user without the proper authorisation.
Set root password? [Y/n] Y
New password: 123456
Re-enter new password: 123456
Password updated successfully!
Reloading privilege tables..
 ... Success!
[root@linux-node1 ~]# mysql -uroot -p
Enter password: 123456
Welcome to the MariaDB monitor.  Commands end with ; or g.
Your MariaDB connection id is 10
Server version: 10.1.20-MariaDB MariaDB Server
Copyright (c) 2000, 2016, Oracle, MariaDB Corporation Ab and others.
Type 'help;' or 'h' for help. Type 'c' to clear the current input statement.
MariaDB [(none)]> create database zabbix character set utf8 collate utf8_bin;
Query OK, 1 row affected (0.00 sec)
MariaDB [(none)]> grant all privileges on zabbix.* to zabbix@localhost identified by 'zabbix';
Query OK, 0 rows affected (0.00 sec)
MariaDB [(none)]> flush privileges;
Query OK, 0 rows affected (0.00 sec)
MariaDB [(none)]> quit;
Bye

导入初始模式和数据:
[root@linux-node1 ~]# zcat /usr/share/doc/zabbix-server-mysql-3.0.13/create.sql.gz |mysql -uzabbix -p zabbix
Enter password: zabbix
[root@linux-node1 ~]# mysql -uroot -p123456 -e "use zabbix;show tables;"
+----------------------------+
| Tables_in_zabbix           |
+----------------------------+
| acknowledges               |
| actions                    |
| alerts                     |
| application_discovery      |
| application_prototype      |
| application_template       |
| applications               |
| auditlog                   |
| auditlog_details           |
| autoreg_host               |
| conditions                 |
| config                     |
|......                     |
+----------------------------+
-
四、Zabbix服务器进程启动
在Zabbix_server.conf编辑数据库配置
[root@linux-node1 ~]# grep ^[a-Z] /etc/zabbix/zabbix_server.conf
LogFile=/var/log/zabbix/zabbix_server.log
LogFileSize=0
PidFile=/var/run/zabbix/zabbix_server.pid
DBHost=localhost
DBName=zabbix
DBUser=zabbix
DBPassword=zabbix
SNMPTrapperFile=/var/log/snmptrap/snmptrap.log
Timeout=4
AlertScriptsPath=/usr/lib/zabbix/alertscripts
ExternalScripts=/usr/lib/zabbix/externalscripts
LogSlowQueries=3000

启动Zabbix服务器进程
[root@linux-node1 ~]# systemctl enable zabbix-server#默认端口为10051
[root@linux-node1 ~]# systemctl start zabbix-server
-
五、编辑Zabbix前端PHP配置
Apache的配置文件/etc/httpd/conf.d/zabbix.conf,取消注释,设置正确的时区:Asia/Shanghai

[root@linux-node1 ~]# vim /etc/httpd/conf.d/zabbix.conf
php_value max_execution_time 300
php_value memory_limit 128M
php_value post_max_size 16M
php_value upload_max_filesize 2M
php_value max_input_time 300
php_value always_populate_raw_post_data -1
php_value date.timezone Asia/Shanghai

通过改变配置文件启动Apache Web服务器

[root@linux-node1 ~]# vim /etc/httpd/conf/httpd.conf
Severname 127.0.0.1:80
[root@linux-node1 ~]# systemctl enable httpd.service
Created symlink from /etc/systemd/system/multi-user.target.wants/httpd.service to /usr/lib/systemd/system/httpd.service.
[root@linux-node1 ~]# systemctl start httpd.service
[root@linux-node1 ~]# netstat -lntp
Active Internet connections (only servers)
Proto Recv-Q Send-Q Local Address           Foreign Address         State       PID/Program name
tcp        0      0 0.0.0.0:22              0.0.0.0:*               LISTEN      863/sshd
tcp        0      0 127.0.0.1:25            0.0.0.0:*               LISTEN      2085/master
tcp6       0      0 :::80                   :::*                    LISTEN      21955/httpd
tcp6       0      0 :::22                   :::*                    LISTEN      863/sshd
tcp6       0      0 ::1:25                  :::*                    LISTEN      2085/master
tcp6       0      0 :::3306                 :::*                    LISTEN      21820/mysqld
-
六、Zabbix的web安装
step1:
在浏览器中,打开Zabbix URL:http:// <server_ip_or_name> / zabbix

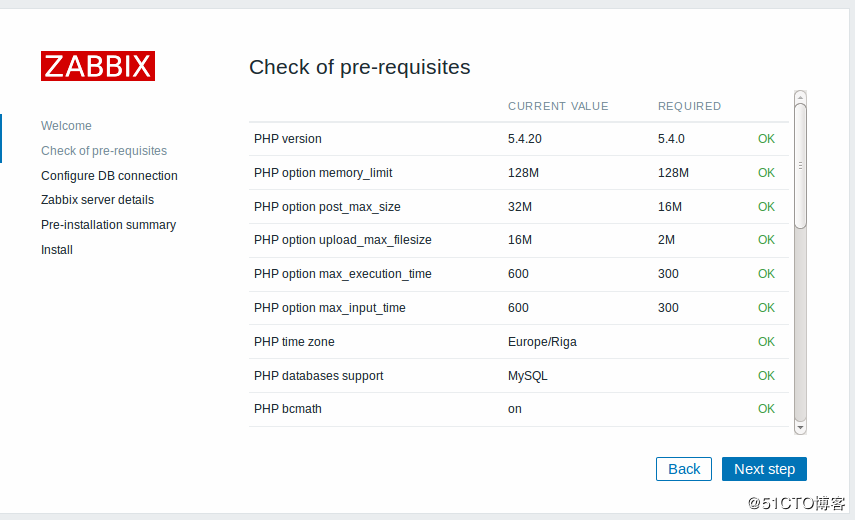
step2:
确保满足所有软件的先决条件。
step3:
输入连接到数据库的详细信息。Zabbix数据库必须已经创建。

step4:
输入Zabbix服务器的详细信息。

step5:
查看设置摘要。

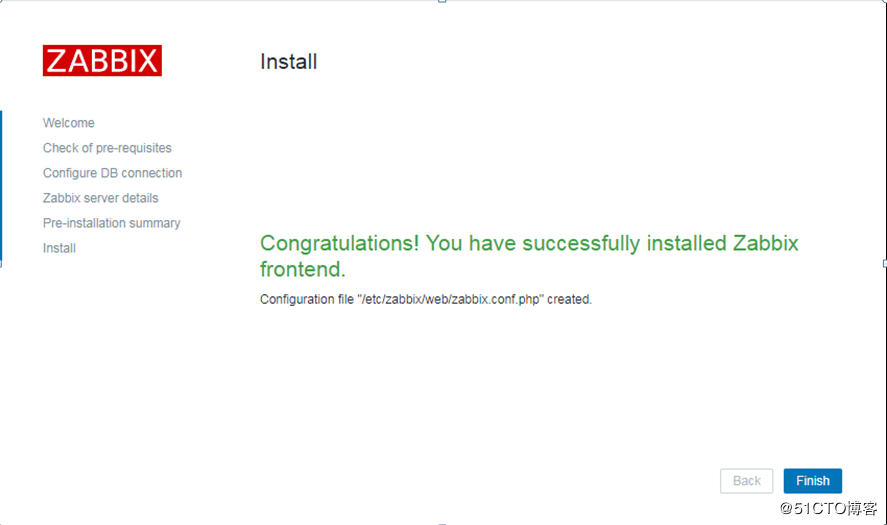
step6:
完成安装,会在/etc/zabbix/web/zabbix.conf.php生成配置文件
当数据库遇到瓶劲,在进行数据库拆分的时候,需要修改配置文件/etc/zabbix/web/zabbix.conf.php,指向新的数据库地址。
[root@linux-node1 ~]# vim /etc/zabbix/web/zabbix.conf.php
<?php
// Zabbix GUI configuration file.
global $DB;
$DB['TYPE']     = 'MYSQL';
$DB['SERVER']   = 'localhost';
$DB['PORT']     = '0';
$DB['DATABASE'] = 'zabbix';
$DB['USER']     = 'zabbix';
$DB['PASSWORD'] = 'zabbix';
// Schema name. Used for IBM DB2 and PostgreSQL.
$DB['SCHEMA'] = '';
$ZBX_SERVER      = 'localhost';
$ZBX_SERVER_PORT = '10051';
$ZBX_SERVER_NAME = '';
$IMAGE_FORMAT_DEFAULT = IMAGE_FORMAT_PNG;
step7:
Zabbix前端准备就绪!默认的用户名是Admin,密码zabbix。

#####################################################################################
-
1.zabbix_get命令详解
安装zabbix-get命令
[root@linux-node1 ~]# yum install -y zabbix_get
参数说明:
-s --host: 指定客户端主机名或者IP
-p --port:客户端端口,默认10050
-I --source-address:指定源IP,写上zabbix server的ip地址即可,一般留空,服务器如果有多ip的时候,你指定一个。
-k --key:你想获取的key

获取负载:
[root@linux-node1 ~]# zabbix_get -s 127.0.0.1 -k system.cpu.load[,avg5]
0.030000
获取cpu空闲百分比:
[root@linux-node1 ~]# zabbix_get -s linux-node2 -k system.cpu.util[,idle]
99.916206
-
2.安装zabbix-agent
[root@linux-node2 ~]# yum install -y zabbix-agent
[root@linux-node2 ~]# vim /etc/zabbix/zabbix_agentd.conf
Server=192.168.56.11
ServerActive=192.168.56.11:10050
HostnameItem=system.hostname
[root@linux-node2 ~]# systemctl enable zabbix-agent
[root@linux-node2 ~]# systemctl start zabbix-agent
[root@linux-node2 ~]# netstat -tulnp
Active Internet connections (only servers)
Proto Recv-Q Send-Q Local Address           Foreign Address         State       PID/Program name
tcp        0      0 0.0.0.0:22              0.0.0.0:*               LISTEN      866/sshd
tcp        0      0 127.0.0.1:25            0.0.0.0:*               LISTEN      2235/master
tcp        0      0 0.0.0.0:10050           0.0.0.0:*               LISTEN      24188/zabbix_agentd
tcp6       0      0 :::22                   :::*                    LISTEN      866/sshd
tcp6       0      0 ::1:25                  :::*                    LISTEN      2235/master
tcp6       0      0 :::10050                :::*                    LISTEN      24188/zabbix_agentd
-
3.添加主机监控
Configuration-->Hosts-->create host-->填写主机名、所属组-->链接模板"Templates"-->ADD


-
4.创建自定义Key监控
在客户端配置文件 zabbix_angentd.conf 里面配置 UserParameter。语法如下:
UserParameter=key,command(key是自定义的,command是使用命令获取数值的方法;在取值时尽量避免使用管道,以免获取数值超时)
查看系统上的自定义Key格式:

[root@linux-node2 zabbix_agentd.d]# tail -2 userparameter_mysql.conf
UserParameter=mysql.ping,HOME=/var/lib/zabbix mysqladmin ping | grep -c alive
UserParameter=mysql.version,mysql -V

创建自定义key,监控/etc/services大小。直接写一个conf文件,将自定义Key写入
[root@linux-node2 zabbix_agentd.d]# cat monitor_file.conf
UserParameter=monitor_file,stat -c %s /etc/services

重启zabbix-agent
[root@linux-node2 zabbix_agentd.d]# systemctl restart zabbix-agent
[root@linux-node2 ~]# netstat -tulnp
Active Internet connections (only servers)
Proto Recv-Q Send-Q Local Address           Foreign Address         State       PID/Program name
tcp        0      0 0.0.0.0:22              0.0.0.0:*               LISTEN      866/sshd
tcp        0      0 127.0.0.1:25            0.0.0.0:*               LISTEN      2235/master
tcp        0      0 0.0.0.0:10050           0.0.0.0:*               LISTEN      24188/zabbix_agentd
tcp6       0      0 :::22                   :::*                    LISTEN      866/sshd
tcp6       0      0 ::1:25                  :::*                    LISTEN      2235/master
tcp6       0      0 :::10050                :::*                    LISTEN      24188/zabbix_agentd

在zabbix-server上使用zabbix_get命令获取监控值
[root@linux-node1 ~]# zabbix_get -s linux-node2 -k monitor_file
670293
-
5.web界面添加item
"Configuration"-->"Host"-->"Items"-->"Create item"

创建完成,可以在监控的最新数据进行查看获取数值

-
6.zabbix的值映射show value mapping
zabbix 为了显示更人性化的数据,在使用过程中,我们可以将获取到得数据映射为一个字符串。比如,我们写脚本监控 MySQL 是否在运行中, 一般返回 0 表示数据库挂了, 1 表示数据库正常,还有各种各样的监控都是返回 0, 1,
2, 3 这样的数据,监控页上显示的都是数据字,完全不知道是什么意思。 为了更加友好地提示,就有一个show value mapping的功能。
下面以监控linux-node2上的80端口为例子。
创建监控项,监听80端口,在show value选择映射Service state,会指向两种状态显示:0-->Down ; 1-->Up


在未启动httpd服务和启动之后的的状态变化都会以Down和Up来展示,这样更能清晰掌握服务的状态。

-
7.Zabbix解决中文乱码
找到本地 C:WindowsFontssimkai.ttf(楷体)上传到服务器 zabbix 网站目录 fonts 目录下。
[root@linux-node1 ~]# cd /usr/share/zabbix/fonts/
[root@linux-node1 fonts]# ll
总用量 0
lrwxrwxrwx 1 root root 33 12月  4 17:43 graphfont.ttf -> /etc/alternatives/zabbix-web-font
[root@linux-node1 fonts]# ll
总用量 11512
lrwxrwxrwx 1 root root       33 12月  4 17:43 graphfont.ttf -> /etc/alternatives/zabbix-web-font
-rw-r--r-- 1 root root 11785184 6月  11 2009 SIMKAI.TTF
[root@linux-node1 fonts]# mv SIMKAI.TTF graphfont.ttf
[root@linux-node1 fonts]# ll
总用量 11512
-rw-r--r-- 1 root root 11785184 6月  11 2009 graphfont.ttf
##################################################################################
-
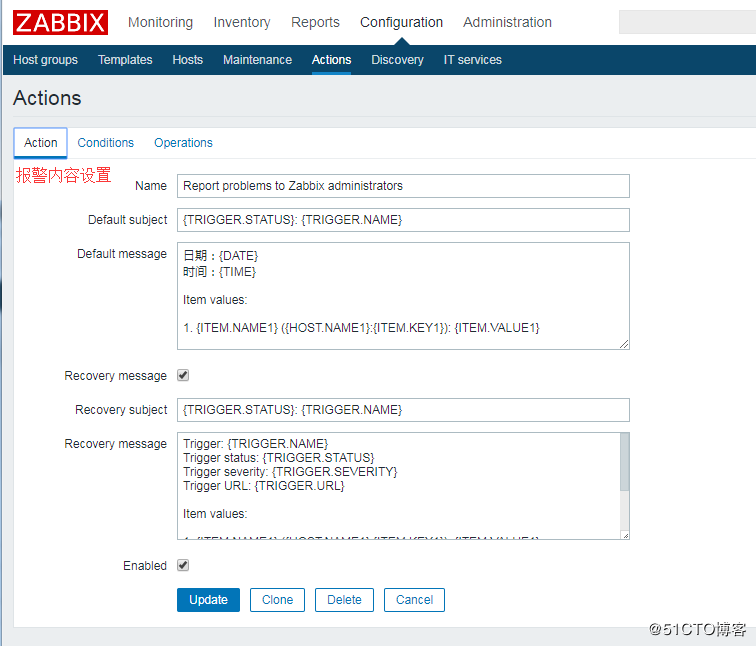
1.设置邮件报警的思路
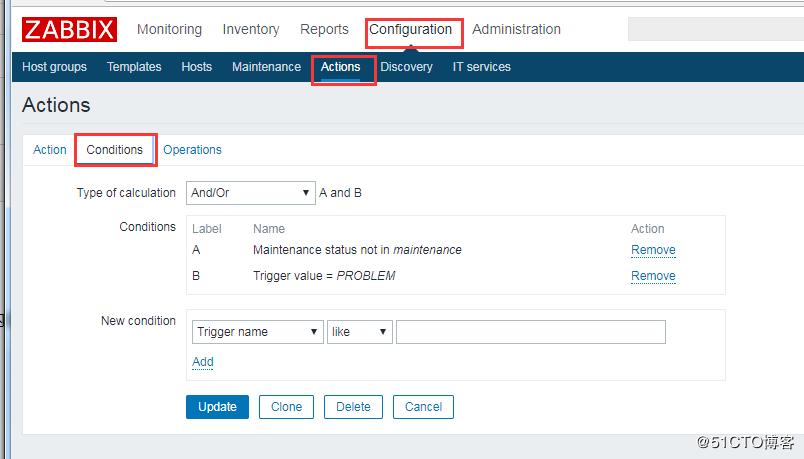
- (1)设置触发器(Trigger)-->触发后需要执行的动作(Action)
触发器使用逻辑表达式来评估通过 item 获取到得数据是处于哪种状态。在触发器表达式中我们可以定义哪些值范围是合理,哪些是不合理的,如果出现不合理的值,触发器会把状态改为
PROBLEM。以监控linux-node2的http端口服务为例:
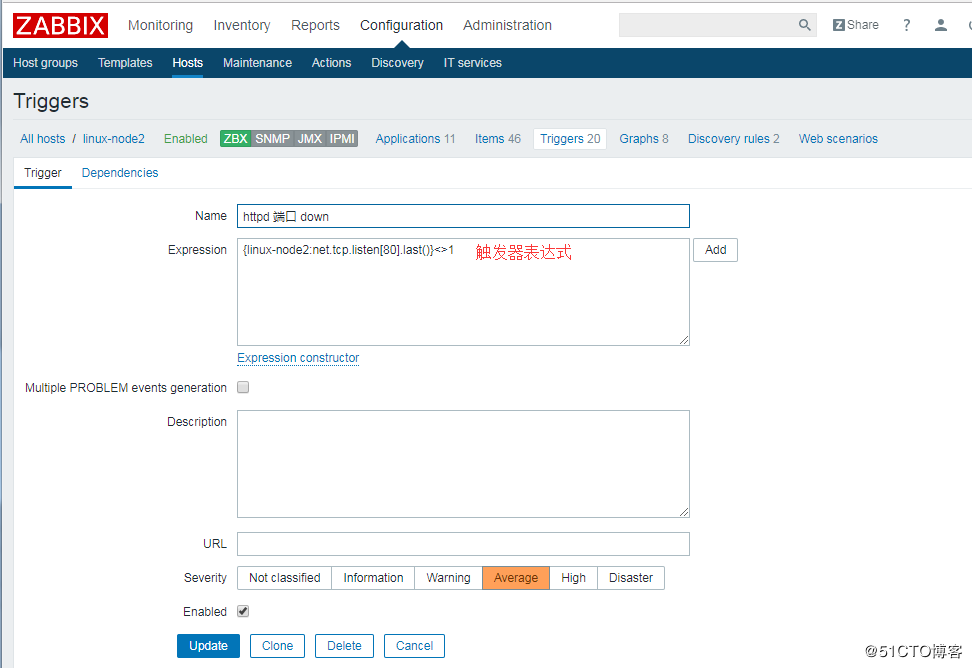
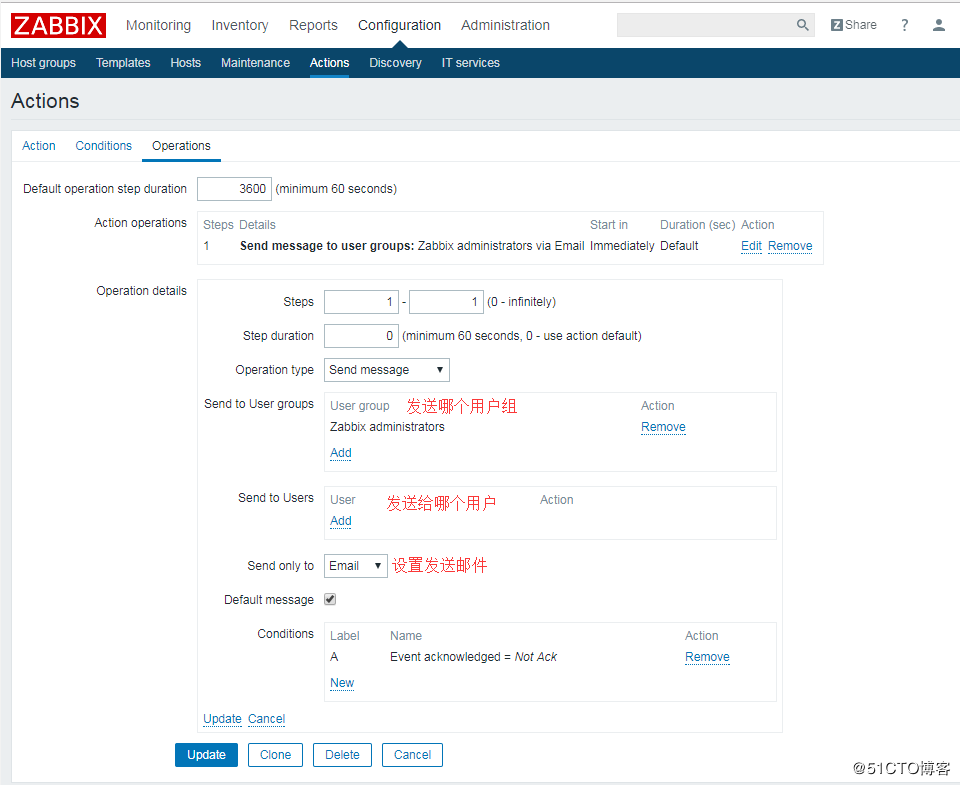
而后,触发器触发会执行响应的动作。这里可以进行配置Action的相关信息,包含报警信息内容,条件,操作。如图当触发器的值变成PROBLEM会执行相应的Operations
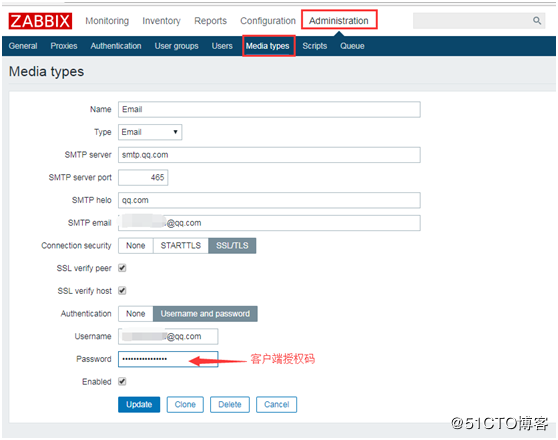
- (2)发件人邮箱设置:"Administration"-->"Media types"-->"Email"
这里使用QQ邮箱发送邮件,需要在QQ邮箱的账户设置授权码,端口为465
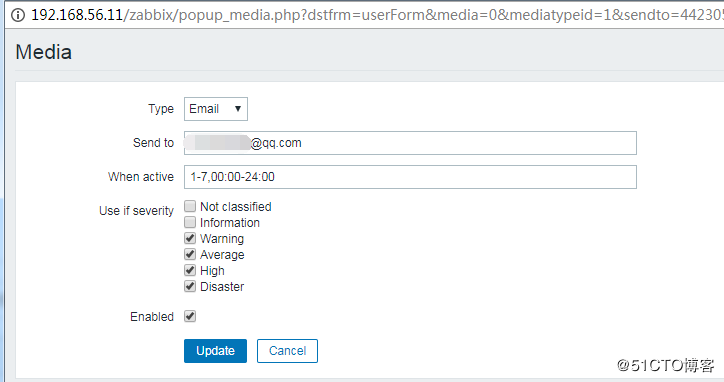
- (3)收件人邮箱设置:"Administration"-->"Users"-->"Admin"-->"Media"-->"ADD"设置告警级别
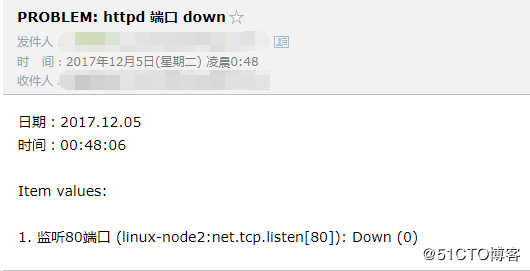
手动停止linux-node2的httpd服务
[root@linux-node2 ~]# systemctl stop httpd

查看是否有邮件信息
##############################################################################
-
1.Zabbix监控web服务器访问性能
zabbix 对 web 性能的监控,通过它可以了解 web 站点的可用性以及性能。最终将各项指标绘制到图形中,这样我们可以了解到一个站点的下载速度、响应速度等。需要注意的是在安装 zabbix server 需要增加 libcurl 的支持。
-
web 检测数据搜集说明:
web 整个检测中会收集如下数据
整个 web 监控规则中的页面平均下载速度,秒为单位
检测阶段发生的错误次数
最后一个错误消息
-
web 检测的任何一个阶段都会收集如下数据:
每秒的下载速度
响应时间
响应代码(http code,如 200、 301 等)
-
2.zabbix 实战监控 WEB 网站性能
监控自建的zabbix网站:
打开网站、登陆、登陆验证、退出,一共 4 个小 step
检测流程:
1) 打开网站:如果 http code 为 200,并且响应的 html 中包含 Zabbix 表示打开成功(zabbix 页面有这个标示)
2) 登陆后台: post 用户名和密码到 index.php,如果响应 200,那表示 post 成功。并且通过正则表达式从响应的html 中匹配 sid,这个 sid 也就是一个宏变量,退出可以使用到
3) 验证登陆:打开首页,检索 html 中是否包含 Dashboard(只有登陆成功,才会有 Dashboard出现)
4) 退出账号:传递参数 sid 给 index.php 即可退出,响应 200 即表示退出成功
-
3.创建 WEB 场景
configuration->Host->你的主机->web->右上角 Create scenario

step1:打开首页

step2:首页登陆

step3:登陆检查

step4:退出登陆

WEB 网站检测配置完成,保存:

查看结果:

##########################################################################################
-
1.linux-node2节点安装数据库
[root@linux-node2 ~]# yum install -y mariadb-server
[root@linux-node2 ~]# systemctl start mariadb
[root@linux-node2 ~]# netstat -tulnp |grep 3306
tcp        0      0 0.0.0.0:3306            0.0.0.0:*               LISTEN      41299/mysqld
-
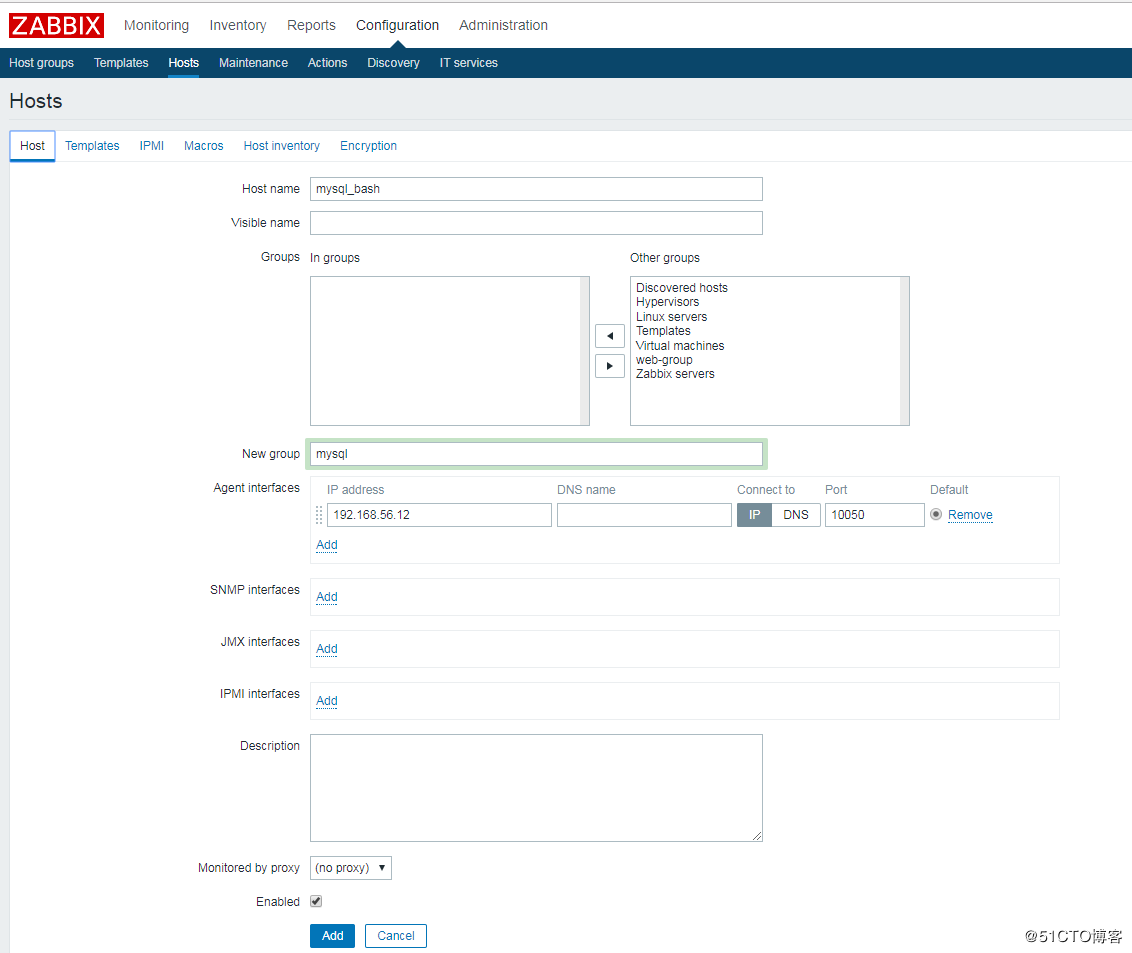
2.Zabbix添加数据库主机监控
被动模式对Hostname没要求,但主动模式必须与主机Hostname一致。
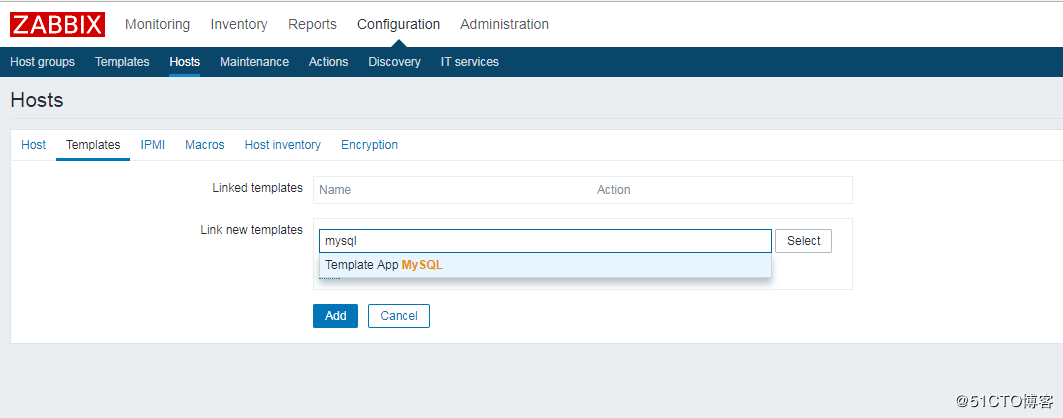
"Configuration"-->"Host"(填入主机信息)-->"Templates"(链接MySQL模板)
如图:
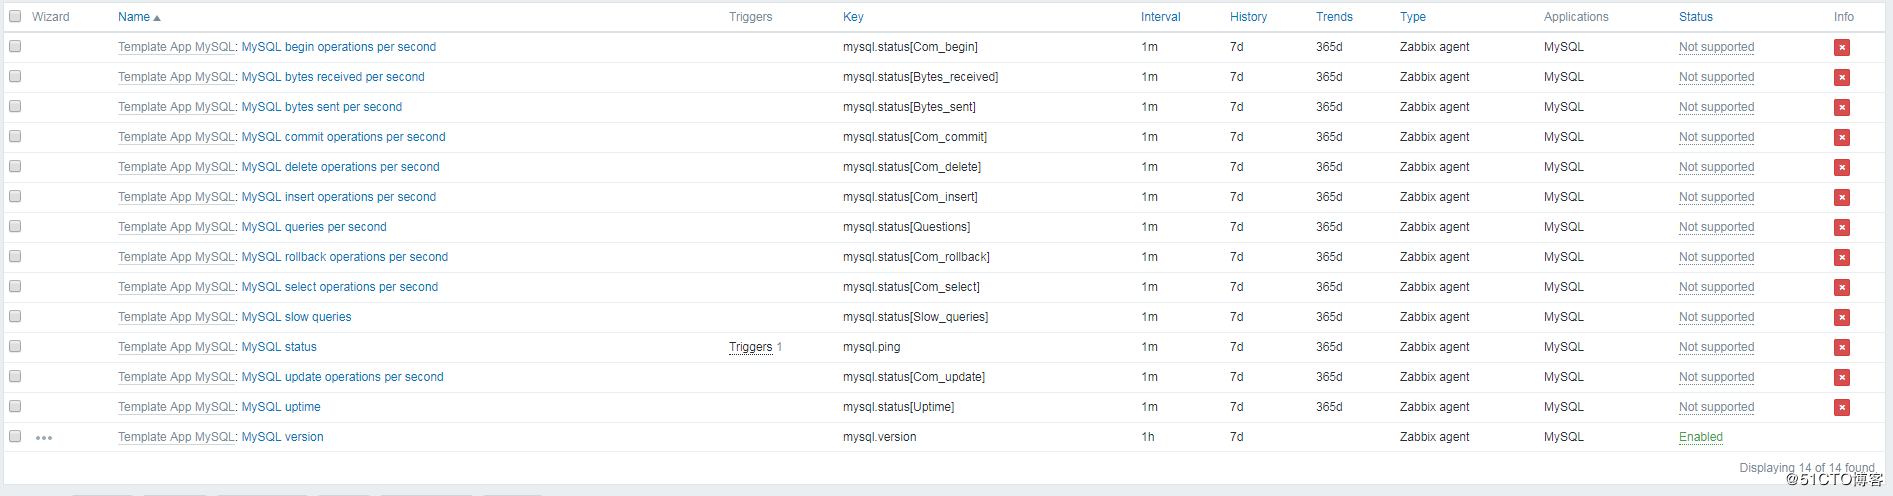
创建成功后,可以查看到MySQL相应的监控信息,数据库的增改删查,如图:


命令行进行查看获取的信息:
[root@linux-node1 ~]# zabbix_get -s linux-node2 -k mysql.status[Com_begin]
0
[root@linux-node1 ~]# zabbix_get -s linux-node2 -k mysql.status[Slow_queries]
0
数据库模板监控配置主要来自linux-node2节点:/etc/zabbix/zabbix_agentd.d/userparameter_mysql.conf 的配置
[root@linux-node2 ~]# vim /etc/zabbix/zabbix_agentd.d/userparameter_mysql.conf

# For all the following commands HOME should be set to the directory that has .my.cnf file with password information.

# Flexible parameter to grab global variables. On the frontend side, use keys like mysql.status[Com_insert].
# Key syntax is mysql.status[variable].
UserParameter=mysql.status[*],echo "show global status where Variable_name='$1';" | HOME=/var/lib/zabbix mysql -N | awk '{print $$2}'    #mysql的状态获取

# Flexible parameter to determine database or table size. On the frontend side, use keys like mysql.size[zabbix,history,data].
# Key syntax is mysql.size[<database>,<table>,<type>].
# Database may be a database name or "all". Default is "all".
# Table may be a table name or "all". Default is "all".
# Type may be "data", "index", "free" or "both". Both is a sum of data and index. Default is "both".
# Database is mandatory if a table is specified. Type may be specified always.
# Returns value in bytes.
# 'sum' on data_length or index_length alone needed when we are getting this information for whole database instead of a single table
UserParameter=mysql.size[*],bash -c 'echo "select sum($(case "$3" in both|"") echo "data_length+index_length";; data|index) echo "$3_length";; free) echo "data_free";; esac)) from information_schema.tables$([[ "$1" = "all" || ! "$1" ]] || echo " where table_schema="$1"")$([[ "$2" = "all" || ! "$2" ]] || echo "and table_name="$2"");" | HOME=/var/lib/zabbix mysql -N'

UserParameter=mysql.ping,HOME=/var/lib/zabbix mysqladmin ping | grep -c alive    #mysql的存活获取
UserParameter=mysql.version,mysql -V    #mysql的版本获取
- 3.带密码对MySQL监控
以上对数据库的监控,都是没有密码直接获取值,这是不合理的,那么需要如何添加密码进行获取监控数据呢?
(1)先对数据库进行授权和密码,通过zabbix用户进行获取数据,此处的授权由于试验,就授权了全部权限,正式生产时不能这样设置。

[root@linux-node2 ~]# mysql
Welcome to the MariaDB monitor.  Commands end with ; or g.
Your MariaDB connection id is 711
Server version: 5.5.56-MariaDB MariaDB Server

Copyright (c) 2000, 2017, Oracle, MariaDB Corporation Ab and others.

Type 'help;' or 'h' for help. Type 'c' to clear the current input statement.

MariaDB [(none)]> grant all on *.* to zabbix@localhost identified by "zabbix";
Query OK, 0 rows affected (0.00 sec)

MariaDB [(none)]> flush privileges;
Query OK, 0 rows affected (0.00 sec)

MariaDB [(none)]> quit;
Bye

(2)修改监控配置,添加用户名密码
[root@linux-node2 ~]# vim /etc/zabbix/zabbix_agentd.d/userparameter_mysql.conf

UserParameter=mysql.status[*],echo "show global status where Variable_name='$1';" | HOME=/var/lib/zabbix mysql -uzabbix -pzabbix -N | awk '{print $$2}'
UserParameter=mysql.size[*],bash -c 'echo "select sum($(case "$3" in both|"") echo "data_length+index_length";; data|index) echo "$3_length";; free) echo "data_free";; esac)) from information_schema.tables$([[ "$1" = "all" || ! "$1" ]] || echo " where table_schema="$1"")$([[ "$2" = "all" || ! "$2" ]] || echo "and table_name="$2"");" | HOME=/var/lib/zabbix mysql -N'
UserParameter=mysql.ping,HOME=/var/lib/zabbix mysqladmin ping -uzabbix -pzabbix | grep -c alive
UserParameter=mysql.version,mysql -V

[root@linux-node2 ~]# systemctl restart zabbix-agent
修改完毕后,我们可以看到在Item项都显示Not supported,如图:
此时修改一下zabbix对无效监控项的刷新时间,默认是600s,我们改为30s。修改完成后就会变成enabled
"Administration"-->"General"-->右上角选择"other"-->"Refresh unsupported items (in sec)"改为30
-
4.灵活使用宏变量(Macrros)进行传参配置用户名密码监控
如图:在主机中配置变量
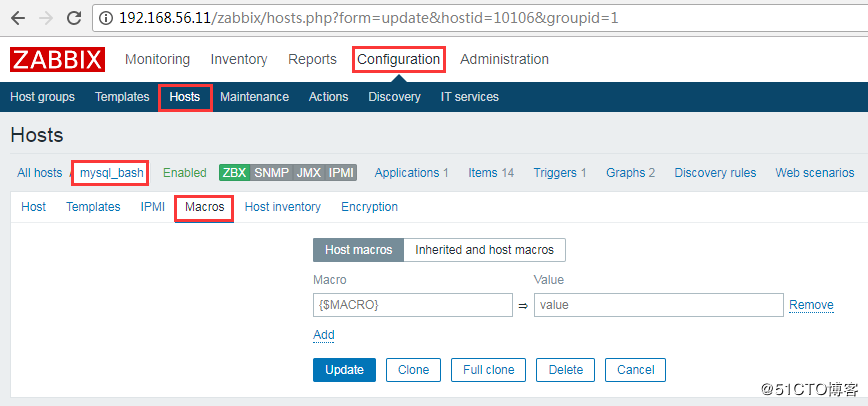
(1)修改配置文件:
[root@linux-node2 ~]# vim /etc/zabbix/zabbix_agentd.d/userparameter_mysql.conf
UserParameter=mysql.status[*],echo "show global status where Variable_name='$3';" | HOME=/var/lib/zabbix mysql -u$1 -p$2 -N | awk '{print $$2}'
UserParameter=mysql.ping[*],HOME=/var/lib/zabbix mysqladmin -u$1 -p$2 ping| grep -c alive
[root@linux-node2 ~]# systemctl restart zabbix-agent

此时,如果未传入用户名密码访问是被拒绝的:
[root@linux-node1 ~]# zabbix_get -s linux-node2 -k mysql.status[Slow_queries]
Enter password: ERROR 1045 (28000): Access denied for user 'Slow_queries'@'localhost' (using password: YES)
[root@linux-node1 ~]# zabbix_get -s linux-node2 -k mysql.status[zabbix,zabbix,Slow_queries]
0

(2)修改模板,模板中的变量值可以不设置,因为在连接模板时进行修改变量,此时会自动覆盖在模板设置的变量值:
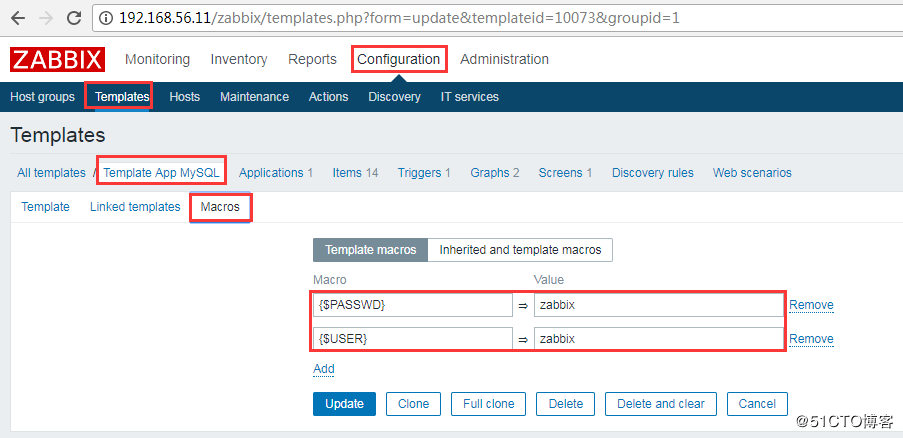
(3)修改模板中的Item:增加传参的变量{$USER},{PASSWD}

##########################################################################################
- TCP状态监控
Tcp的连接状态对于我们web服务器来说是至关重要的,尤其是并发量ESTAB;或者是syn_recv值,假如这个值比较大的话我们可以认为是不是受到了***,或是是time_wait值比较高的话,我们要考虑看我们内核是否需要调优,太高的time_wait值的话会占用太多端口。
-
1.配置agent
添加监控配置文件并在server中测试能否获取值:
[root@linux-node2 zabbix_agentd.d]# cat monitor_tcp.conf
UserParameter=TCP_Status[*],ss -ant |grep -c $1

[root@linux-node2 zabbix_agentd.d]# systemctl restart zabbix-agent
[root@linux-node1 ~]# zabbix_get -s linux-node2 -k TCP_Status[LISTEN]
9
-
2.创建TCP状态监控模板
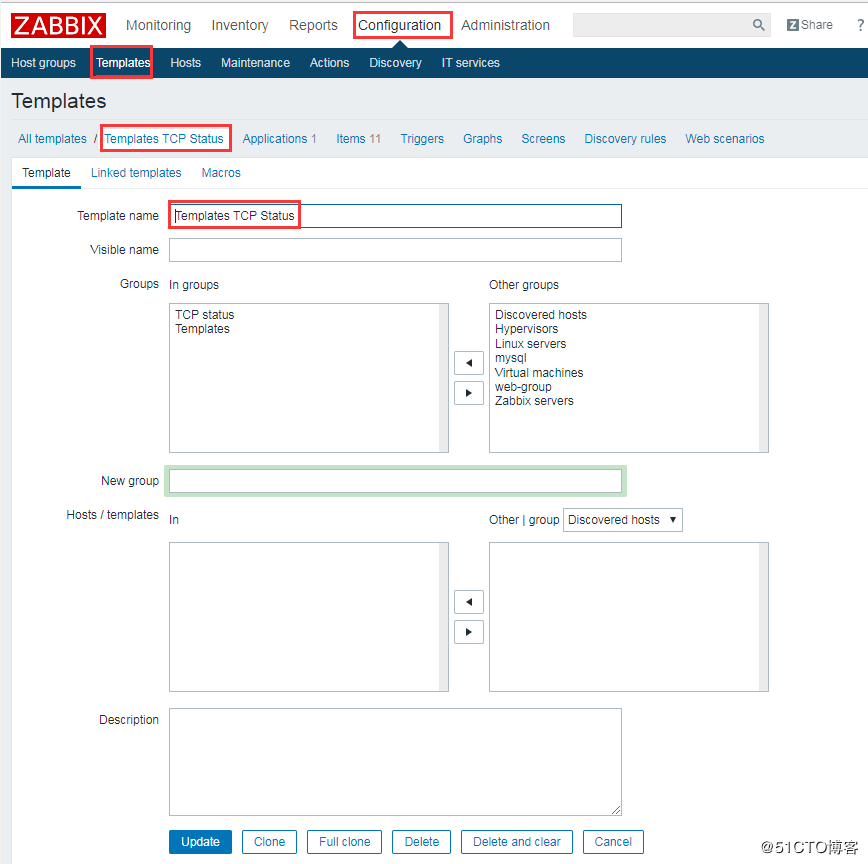
添加监控项,添加一个,之后的使用Clone的功能再修改:
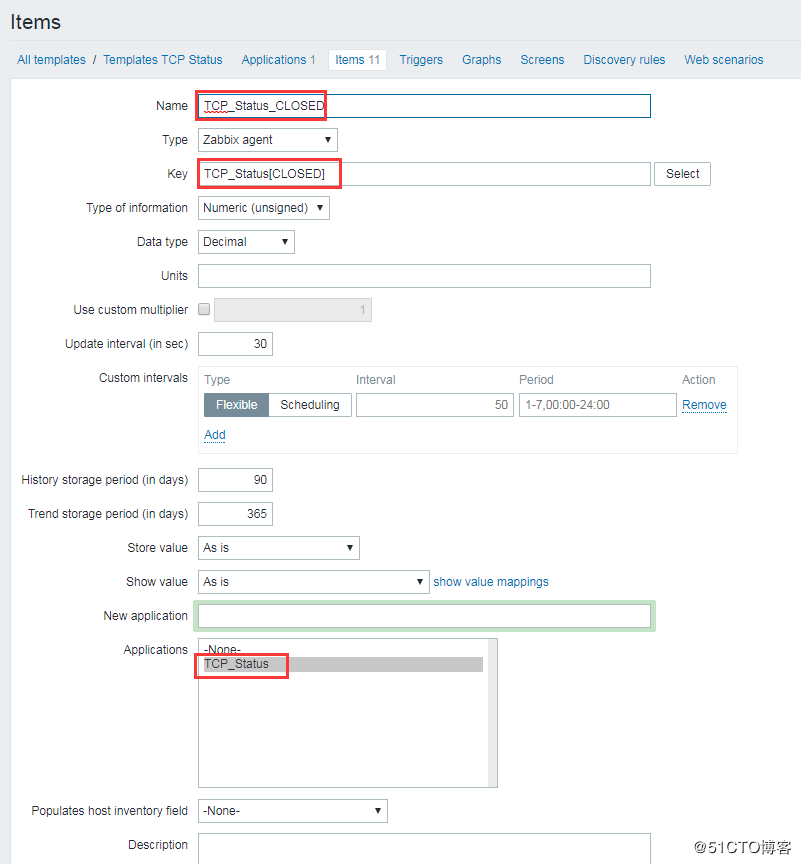

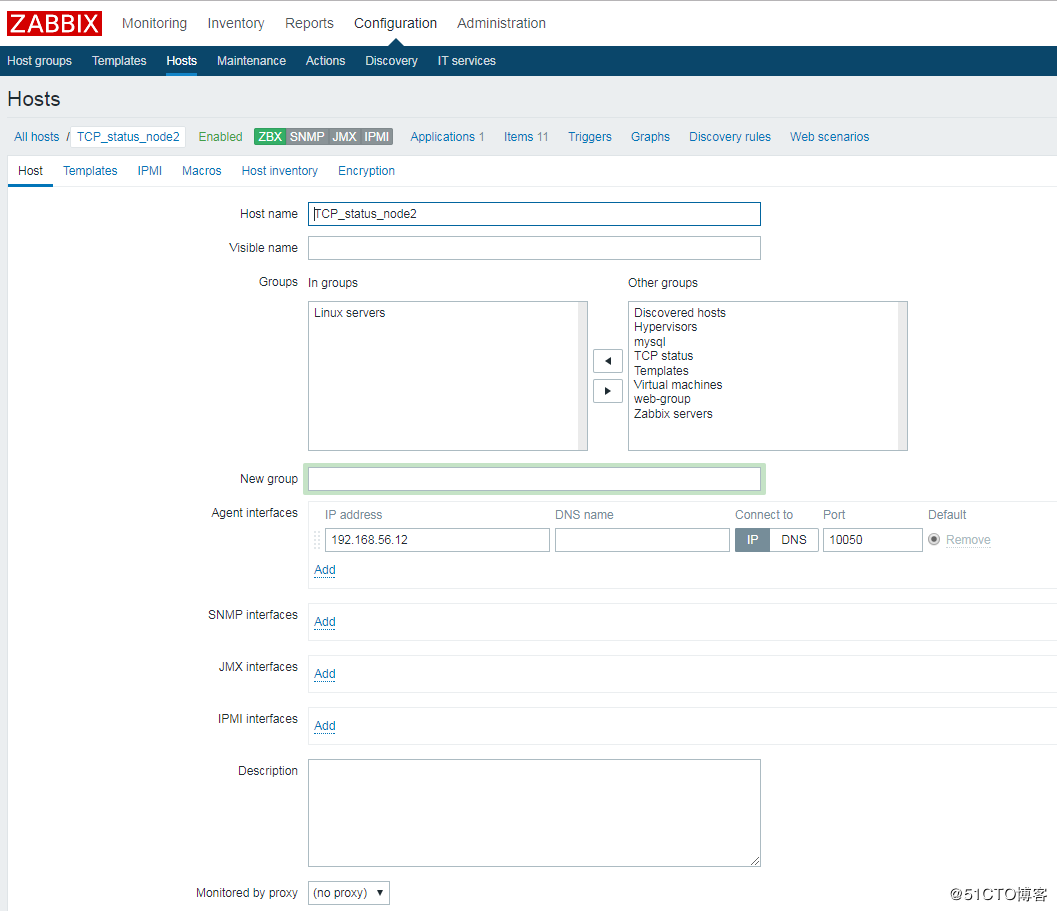
3.创建一个监控主机,监控其TCP状态
"Configuration"-->"Host"-->"链接到创建的TCP状态监控模板"-->"监控查看TCP状态图"

###################################################################################
-
1、安装nginx
[root@linux-node2 ~]# yum install -y nginx
[root@linux-node2 ~]# mkdir /etc/zabbix/zabbix_agentd.d/scripts    #创建脚本文件夹
[root@linux-node2 ~]# vim /etc/nginx/nginx.conf
在server内增加nginx状态监控,nginx的状态主要来自nginx的自带的模块
       location /nginx_status {
                stub_status on;
                access_log off;
                allow 192.168.56.0/24;
                allow 127.0.0.1;
                deny all;
        }
[root@linux-node2 ~]# nginx -t
nginx: the configuration file /etc/nginx/nginx.conf syntax is ok
nginx: configuration file /etc/nginx/nginx.conf test is successful
[root@linux-node2 ~]# systemctl restart nginx
[root@linux-node1 ~]# curl http://192.168.56.12/nginx_status
Active connections: 1
server accepts handled requests
 9 9 7
Reading: 0 Writing: 1 Waiting: 0

Nginx状态解释:
Active connections  Nginx正处理的活动链接数1个
server              Nginx启动到现在共处理了9个连接。
accepts             Nginx启动到现在共成功创建9次握手。
handled requests    Nginx总共处理了7次请求。
Reading             Nginx读取到客户端的 Header 信息数。
Writing             Nginx返回给客户端的 Header 信息数。
Waiting             Nginx已经处理完正在等候下一次请求指令的驻留链接,开启。
Keep-alive的情况下,Waiting这个值等于active-(reading + writing)。
请求丢失数=(握手数-连接数)可以看出,本次状态显示没有丢失请求。
-
2、添加agent的监控nginx状态配置
[root@linux-node2 ~]# vim /etc/zabbix/zabbix_agentd.d/nginx_monitor.conf
UserParameter=nginx_status[*],/bin/bash /etc/zabbix/zabbix_agentd.d/scripts/nginx_monitor.sh "$1"
-
3、编写获取nginx状态的shell脚本
[root@linux-node2 ~]# vim nginx_monitor.sh
NGINX_PORT=80
NGINX_COMMAND=$1
nginx_active(){
    /usr/bin/curl -s "http://127.0.0.1:"$NGINX_PORT"/nginx_status/" |awk '/Active/ {print $NF}'
}
nginx_reading(){
    /usr/bin/curl -s "http://127.0.0.1:"$NGINX_PORT"/nginx_status/" |awk '/Reading/ {print $2}'
}
nginx_writing(){
    /usr/bin/curl -s "http://127.0.0.1:"$NGINX_PORT"/nginx_status/" |awk '/Writing/ {print $4}'
       }
nginx_waiting(){
    /usr/bin/curl -s "http://127.0.0.1:"$NGINX_PORT"/nginx_status/" |awk '/Waiting/ {print $6}'
       }
nginx_accepts(){
    /usr/bin/curl -s "http://127.0.0.1:"$NGINX_PORT"/nginx_status/" |awk 'NR==3 {print $1}'
       }
nginx_handled(){
    /usr/bin/curl -s "http://127.0.0.1:"$NGINX_PORT"/nginx_status/" |awk 'NR==3 {print $2}'
       }
nginx_requests(){
    /usr/bin/curl -s "http://127.0.0.1:"$NGINX_PORT"/nginx_status/" |awk 'NR==3 {print $3}'
       }
  case $NGINX_COMMAND in
active)
nginx_active;
;;
reading)
nginx_reading;
;;
writing)
nginx_writing;
;;
waiting)
nginx_waiting;
;;
accepts)
nginx_accepts;
;;
handled)
nginx_handled;
;;
requests)
nginx_requests;
;;
      *)
echo $"USAGE:$0 {active|reading|writing|waiting|accepts|handled|requests}"
    esac

给脚本添加执行权限
[root@linux-node2 scripts]# chmod +x nginx_status.sh
[root@linux-node2 ~]# systemctl restart zabbix-agent
测试一定使用Zabbix_get来获取值:
[root@linux-node1 ~]# zabbix_get -s 192.168.56.12 -k nginx_status[accepts]
10
-
4、创建监控模板以及添加监控项,并添加监控主机:
步骤和监控TCP状态一样:


总结:
添加自定义的监控有以下步骤:
(1)在/etc/zabbix/zabbix_agentd.d/目录下增加自定义监控项(item)
(2)在zabbix-server上测试使用自定义监控项是否能获取值
(3)创建监控模板
(4)创建监控主机并链接监控模板
(5)查看监控最新数据,是否生效
###############################################################################
-
1、网络发现
分两步走:创建发现规则(rule)和执行的动作(Action)
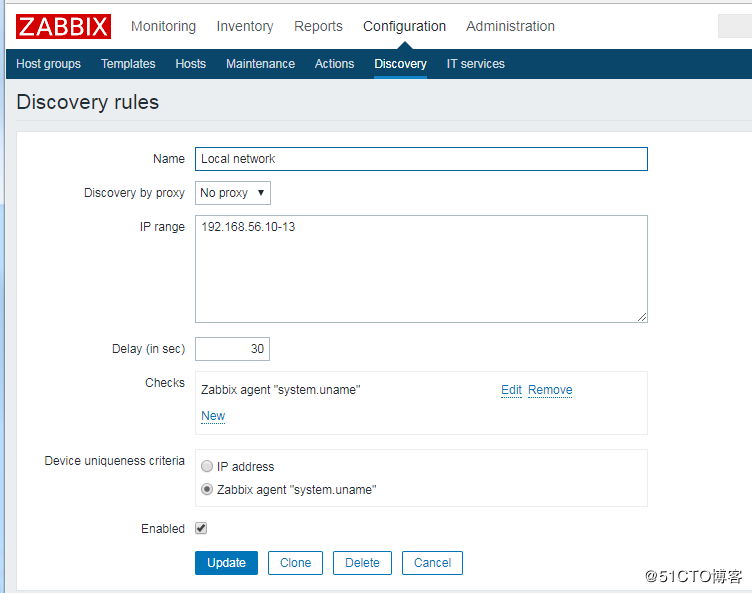
(1)创建发现规则
"Configuration"-->"Create discovery rule"
设置规则名:NAME
设置IP发现范围:IP range
设置多久执行一次:Delay (in sec)
支持的Checks:Zabbix_agent
设备的唯一标识:Device uniqueness criteria
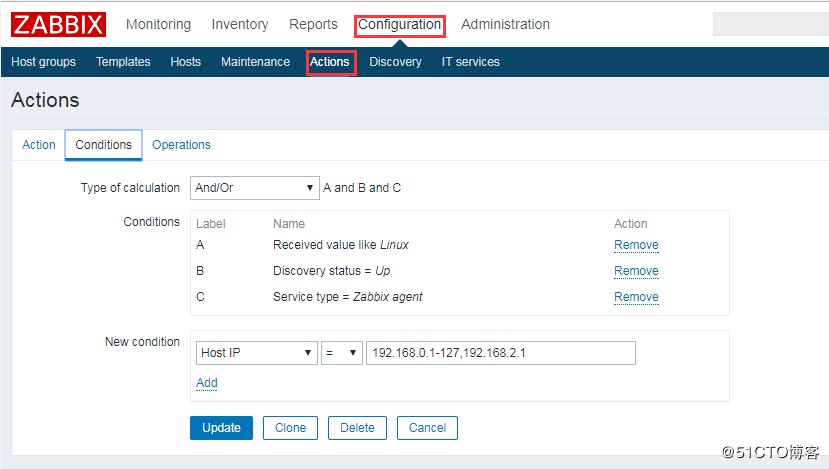
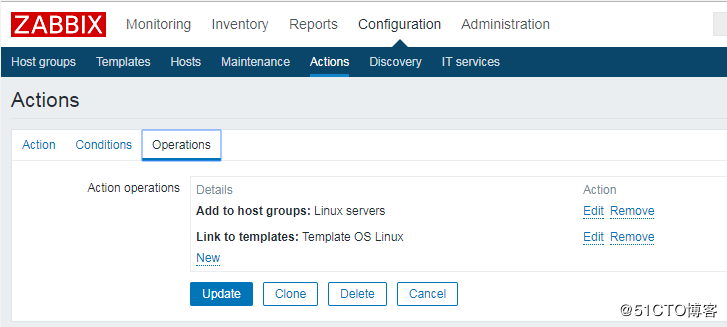
(2)配置发现主机后执行的动作
configuration>>action>>Event source(选 discover) >>create action
①配置Action名称
②条件(如Discovery status,Service type等)
③操作(如加入到某个主机组,链接主机模板等)
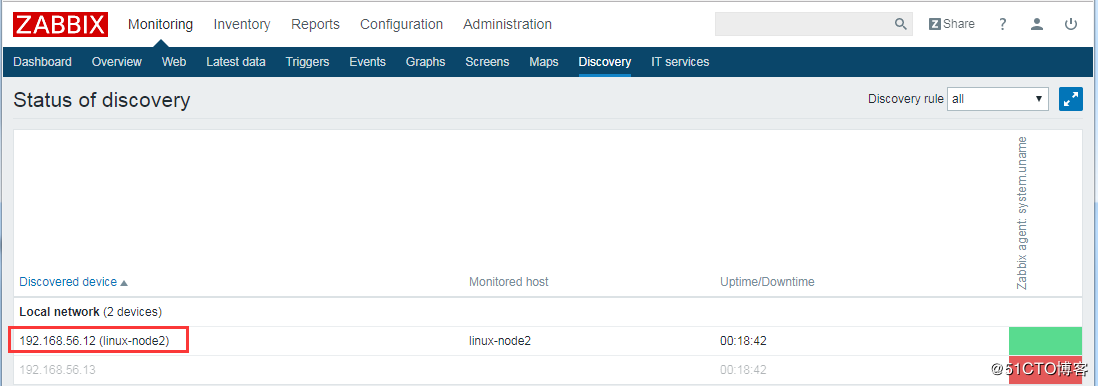
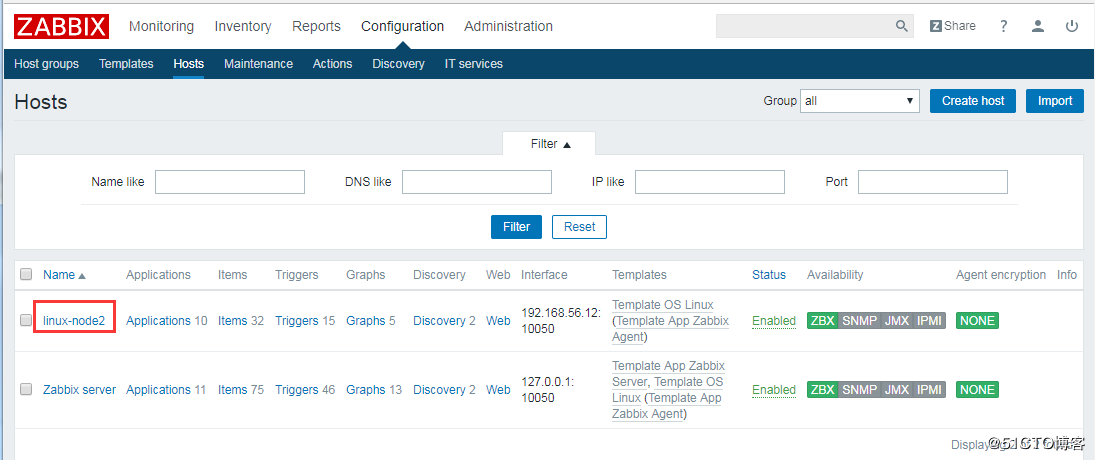
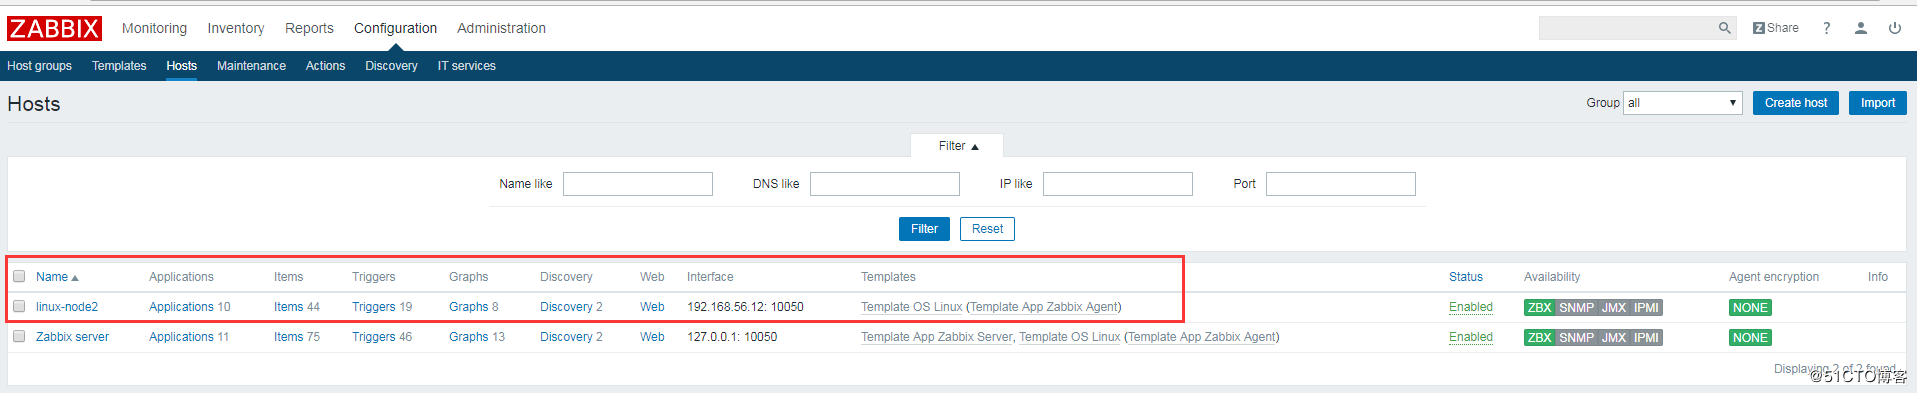
从"Monitoring"-->"Discovery"发现了linux-node2主机,再查看"Configuration"-->"Host"可以发现linux-node2主机已经自动添加成功,并链接了模板。
-
2、主动注册
zabbix的网路发现,大概内容是 zabbix server 去扫描一个网段,把在线的主机添加到 Host 列表中。而主动注册,是Active agent 主动联系 zabbix server,最后由 zabbix server 将这些 agent 加到 host里。
在做主动注册时,先把网络发现的规则和action关闭。
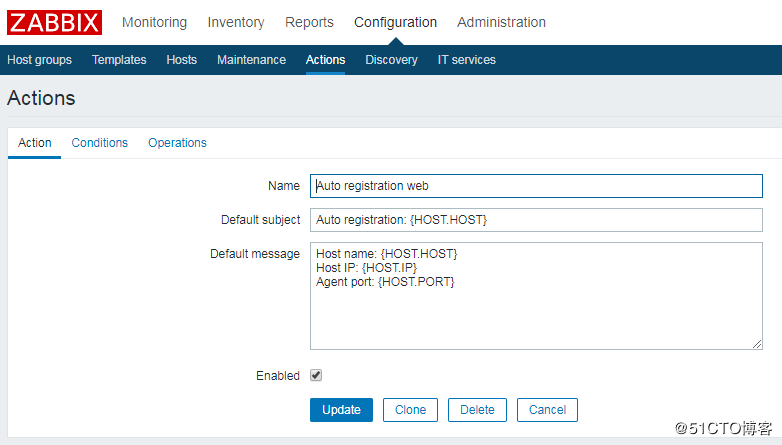
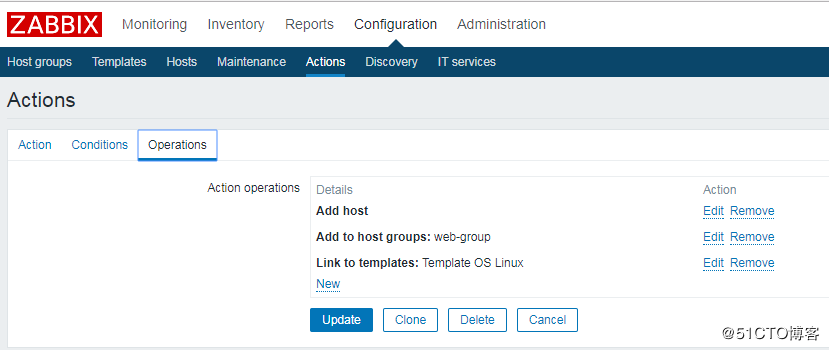
(1)修改配置文件
[root@linux-node2 ~]# vim /etc/zabbix/zabbix_agentd.conf
HostMetadata=web
[root@linux-node2 ~]# systemctl restart zabbix-agent
(2)配置Action
步骤: configuration>>action>>Event source(选择 Auto registration)>>Create Action
与网络发现一样,需要配置action,条件,操作
满足条件的 active host 发起请求, server 会完成三个动作:把 agent 加到 host 列表把 agent 加入web-group 组agent 主机 link 模板 Template OS linux
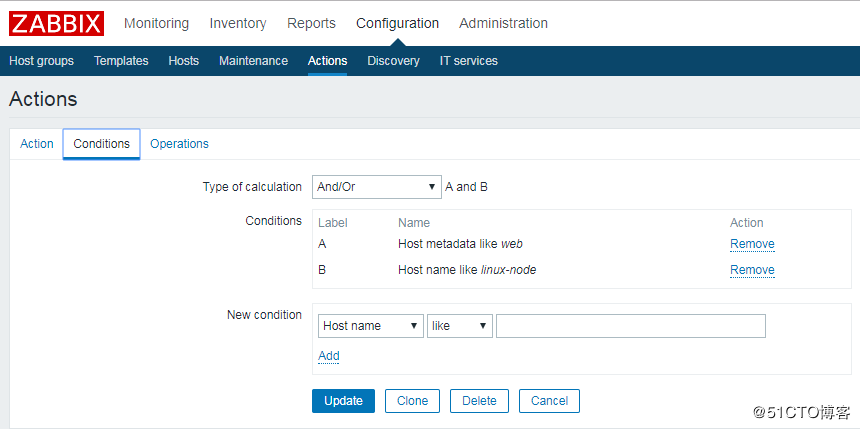
查看结果:
[root@linux-node1 ~]# tailf -1 /var/log/zabbix/zabbix_server.log
21999:20171207:183653.180 enabling Zabbix agent checks on host "linux-node2": host became available
##############################################################################
-
1、概述
Zabbix的网络发现是指zabbix server通过配置好的规则,自动添加host,group,template
Zabbix的主动注册刚好和网络发现是相反的,功能基本一致。zabbix agent主动联系zabbix server,server自动添加host,group,template
以上两种方式都是发现host,添加host,而low-level discovery(低级自动发现)更加底层,用于发现item,trigger,graph等等。
-
2、MySQL多实例的低级自动发现
(1)配置3307、3308的实例
[root@linux-node2 ~]# mkdir /data/{3307,3308} -p
[root@linux-node2 ~]# chown -R mysql.mysql /data
[root@linux-node2 ~]# cp /etc/my.cnf /etc/my3307.cnf
[root@linux-node2 ~]# vim /etc/my3307.cnf
[mysqld]
datadir=/data/3307
socket=/data/3307/mysql.sock
# Disabling symbolic-links is recommended to prevent assorted security risks
symbolic-links=0
port=3307
# Settings user and group are ignored when systemd is used.
# If you need to run mysqld under a different user or group,
# customize your systemd unit file for mariadb according to the
# instructions in http://fedoraproject.org/wiki/Systemd
[mysqld_safe]
log-error=/data/3307/mariadb.log
pid-file=/data/3307/mariadb.pid
#
# include all files from the config directory
#
!includedir /etc/my.cnf.d
[root@linux-node2 ~]# cp /etc/my3307.cnf /etc/my3308.cnf
[root@linux-node2 ~]# vim /etc/my3308.cnf
[mysqld]
datadir=/data/3308
socket=/data/3308/mysql.sock
# Disabling symbolic-links is recommended to prevent assorted security risks
symbolic-links=0
port=3308
# Settings user and group are ignored when systemd is used.
# If you need to run mysqld under a different user or group,
# customize your systemd unit file for mariadb according to the
# instructions in http://fedoraproject.org/wiki/Systemd

[mysqld_safe]
log-error=/data/3308/mariadb.log
pid-file=/data/3308/mariadb.pid

#
# include all files from the config directory
#
!includedir /etc/my.cnf.d

(2)初始化数据库
[root@linux-node2 ~]# mysql_install_db --user=mysql --defaults-file=/etc/my3307.cnf
Installing MariaDB/MySQL system tables in '/data/3307' ...
171218 12:01:02 [Note] /usr/libexec/mysqld (mysqld 5.5.56-MariaDB) starting as process 4804 ...
OK
Filling help tables...
171218 12:01:02 [Note] /usr/libexec/mysqld (mysqld 5.5.56-MariaDB) starting as process 4813 ...
OK

To start mysqld at boot time you have to copy
support-files/mysql.server to the right place for your system

PLEASE REMEMBER TO SET A PASSWORD FOR THE MariaDB root USER !
To do so, start the server, then issue the following commands:

'/usr/bin/mysqladmin' -u root password 'new-password'
'/usr/bin/mysqladmin' -u root -h linux-node2 password 'new-password'

Alternatively you can run:
'/usr/bin/mysql_secure_installation'

which will also give you the option of removing the test
databases and anonymous user created by default.  This is
strongly recommended for production servers.

See the MariaDB Knowledgebase at http://mariadb.com/kb or the
MySQL manual for more instructions.

You can start the MariaDB daemon with:
cd '/usr' ; /usr/bin/mysqld_safe --datadir='/data/3307'

You can test the MariaDB daemon with mysql-test-run.pl
cd '/usr/mysql-test' ; perl mysql-test-run.pl

Please report any problems at http://mariadb.org/jira

The latest information about MariaDB is available at http://mariadb.org/.
You can find additional information about the MySQL part at:
http://dev.mysql.com
Consider joining MariaDB's strong and vibrant community:
https://mariadb.org/get-involved/
[root@linux-node2 ~]# mysqld_safe --defaults-file=/etc/my3307.cnf &
[1] 4825
[root@linux-node2 ~]# 171218 12:01:53 mysqld_safe Logging to '/data/3307/mariadb.log'.
171218 12:01:53 mysqld_safe Starting mysqld daemon with databases from /data/3307

[root@linux-node2 ~]# mysql_install_db --user=mysql --defaults-file=/etc/my3308.cnf
Installing MariaDB/MySQL system tables in '/data/3308' ...
171218 12:03:48 [Note] /usr/libexec/mysqld (mysqld 5.5.56-MariaDB) starting as process 5041 ...
OK
Filling help tables...
171218 12:03:48 [Note] /usr/libexec/mysqld (mysqld 5.5.56-MariaDB) starting as process 5049 ...
OK

To start mysqld at boot time you have to copy
support-files/mysql.server to the right place for your system

PLEASE REMEMBER TO SET A PASSWORD FOR THE MariaDB root USER !
To do so, start the server, then issue the following commands:

'/usr/bin/mysqladmin' -u root password 'new-password'
'/usr/bin/mysqladmin' -u root -h linux-node2 password 'new-password'

Alternatively you can run:
'/usr/bin/mysql_secure_installation'

which will also give you the option of removing the test
databases and anonymous user created by default.  This is
strongly recommended for production servers.

See the MariaDB Knowledgebase at http://mariadb.com/kb or the
MySQL manual for more instructions.

You can start the MariaDB daemon with:
cd '/usr' ; /usr/bin/mysqld_safe --datadir='/data/3308'

You can test the MariaDB daemon with mysql-test-run.pl
cd '/usr/mysql-test' ; perl mysql-test-run.pl

Please report any problems at http://mariadb.org/jira

The latest information about MariaDB is available at http://mariadb.org/.
You can find additional information about the MySQL part at:
http://dev.mysql.com
Consider joining MariaDB's strong and vibrant community:
https://mariadb.org/get-involved/

[root@linux-node2 ~]# mysqld_safe --defaults-file=/etc/my3308.cnf &
[2] 5061
[root@linux-node2 ~]# 171218 12:03:56 mysqld_safe Logging to '/data/3308/mariadb.log'.
171218 12:03:56 mysqld_safe Starting mysqld daemon with databases from /data/3308

[root@linux-node2 ~]# netstat -tulnp
Active Internet connections (only servers)
Proto Recv-Q Send-Q Local Address           Foreign Address         State       PID/Program name
tcp        0      0 0.0.0.0:3307            0.0.0.0:*               LISTEN      4972/mysqld
tcp        0      0 0.0.0.0:3308            0.0.0.0:*               LISTEN      5207/mysqld
tcp        0      0 0.0.0.0:80              0.0.0.0:*               LISTEN      8237/nginx: master
tcp        0      0 0.0.0.0:22              0.0.0.0:*               LISTEN      866/sshd
tcp        0      0 127.0.0.1:25            0.0.0.0:*               LISTEN      2235/master
tcp        0      0 0.0.0.0:10050           0.0.0.0:*               LISTEN      3263/zabbix_agentd
tcp        0      0 0.0.0.0:3306            0.0.0.0:*               LISTEN      4645/mysqld
tcp6       0      0 :::22                   :::*                    LISTEN      866/sshd
tcp6       0      0 ::1:25                  :::*                    LISTEN      2235/master
tcp6       0      0 :::10050                :::*                    LISTEN      3263/zabbix_agentd
[root@linux-node2 ~]# netstat -tulnp |grep mysql|awk -F "[ :]+" '{print $5}'
3307
3308
3306


(3)编写获取端口号的shell脚本
[root@linux-node2 scripts]# vim discovery_mysql.sh
#!/bin/bash
#mysql low-lever discovery
res=`netstat -lntp|grep mysql |awk -F "[ :]+" '{print $5}'`
port=($res)
printf '{'
printf '"data":['
for key in ${!port[@]}
do
        if [[ "${#port[@]}" -gt 1 && "${key}"  -ne "$((${#port[@]}-1))" ]];then
                printf '{'
                printf ""{#MYSQLPORT}":"${port[${key}]}"},"
        else [[ "${key}" -eq "((${#port[@]}-1))" ]]
                printf '{'
                printf ""{#MYSQLPORT}":"${port[${key}]}"}"
        fi
done
printf ']'
printf '}'
[root@linux-node2 scripts]# sh discovery_mysql.sh |python -m json.tool    #采用json格式显示
{
    "data": [
        {
            "{#MYSQLPORT}": "3307"
        },
        {
            "{#MYSQLPORT}": "3308"
        },
        {
            "{#MYSQLPORT}": "3306"
        }
    ]
}

[root@linux-node2 zabbix_agentd.d]# vim discovery_mysql.conf    #编辑自定义key
UserParameter=discovery_mysql,/bin/bash /etc/zabbix/zabbix_agentd.d/scripts/discovery_mysql.sh
[root@linux-node1 ~]# zabbix_get -s linux-node2 -k discovery_mysql    #测试server端获取数据
(Not all processes could be identified, non-owned process info
 will not be shown, you would have to be root to see it all.)
{"data":[]}
#这里报错是因为netstat -tulnp的参数-p在执行时需要root的权限,这里使用suid的方式进行授权

[root@linux-node2 ~]# chmod u+s `which netstat`
[root@linux-node2 ~]# ll `which netstat`
-rwsr-xr-x. 1 root root 155000 8月   3 17:17 /usr/bin/netstat
[root@linux-node1 ~]# zabbix_get -s linux-node2 -k discovery_mysql
{"data":[{"{#MYSQLPORT}":"3307"},{"{#MYSQLPORT}":"3308"},{"{#MYSQLPORT}":"3306"}]}

(4)编辑自定义key,获取每个端口的状态数据
[root@linux-node2 zabbix_agentd.d]# cat userparameter_mysql.conf
UserParameter=mysql.status[*],echo "show global status where Variable_name='$2';" | HOME=/var/lib/zabbix mysql -uroot -p123456 -h 127.0.0.1 -P $1 -N | awk '{print $$2}'

修改不同端口的mysql密码:
[root@linux-node2 zabbix_agentd.d]# mysqladmin -h 127.0.0.1 -uroot password '123456' -P3306
[root@linux-node2 zabbix_agentd.d]# mysqladmin -h 127.0.0.1 -uroot password '123456' -P3307
[root@linux-node2 zabbix_agentd.d]# mysqladmin -h 127.0.0.1 -uroot password '123456' -P3308
测试是否正常
[root@linux-node2 zabbix_agentd.d]# mysql -uroot -p123456 -h 127.0.0.1 -P3306 -e "use mysql;show GLOBAL VARIABLES like 'port';"
+---------------+-------+
| Variable_name | Value |
+---------------+-------+
| port          | 3306  |
+---------------+-------+
[root@linux-node2 zabbix_agentd.d]# mysql -uroot -p123456 -h 127.0.0.1 -P3307 -e "use mysql;show GLOBAL VARIABLES like 'port';"
+---------------+-------+
| Variable_name | Value |
+---------------+-------+
| port          | 3307  |
+---------------+-------+
[root@linux-node2 zabbix_agentd.d]# mysql -uroot -p123456 -h 127.0.0.1 -P3308 -e "use mysql;show GLOBAL VARIABLES like 'port';"
+---------------+-------+
| Variable_name | Value |
+---------------+-------+
| port          | 3308  |
+---------------+-------+
zabbix_get测试是否能正常获取数据:
[root@linux-node1 ~]# zabbix_get -s linux-node2 -k mysql.status[3306,Bytes_sent]
1808
-
3、创建发现规则
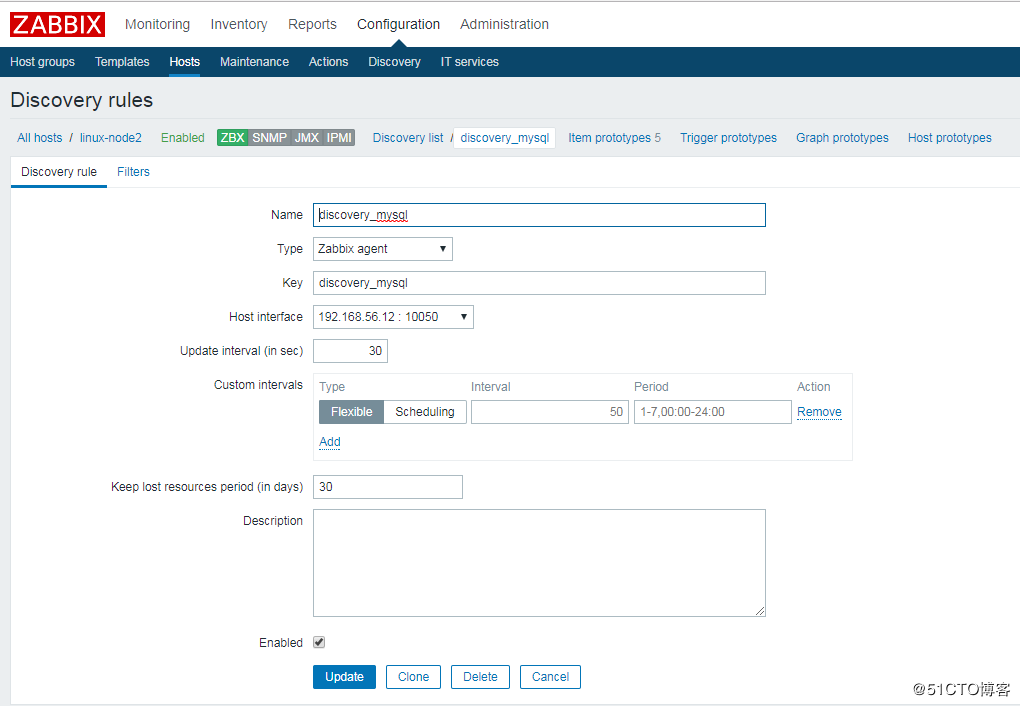
这里直接在linux-node2上进行创建
"Configuration"-->"Host"-->"linux-node2"-->"Discovery"-->"Create discovery rule"-->"Add"
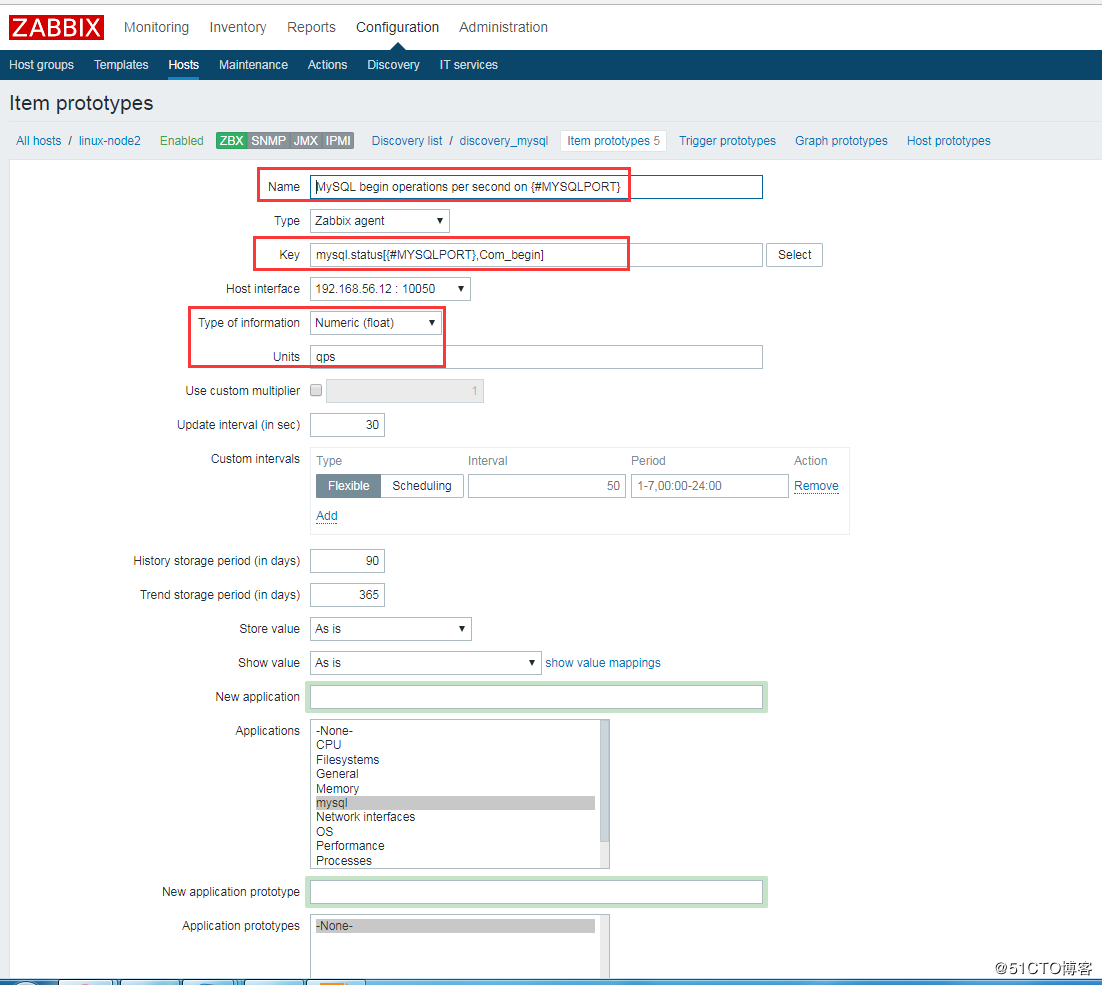
创建 Item prototypes,其实就是一个创建一个 item
Item prototypes (0)>>create Item prototypes,按照官方模板来配置。这里配5个展示

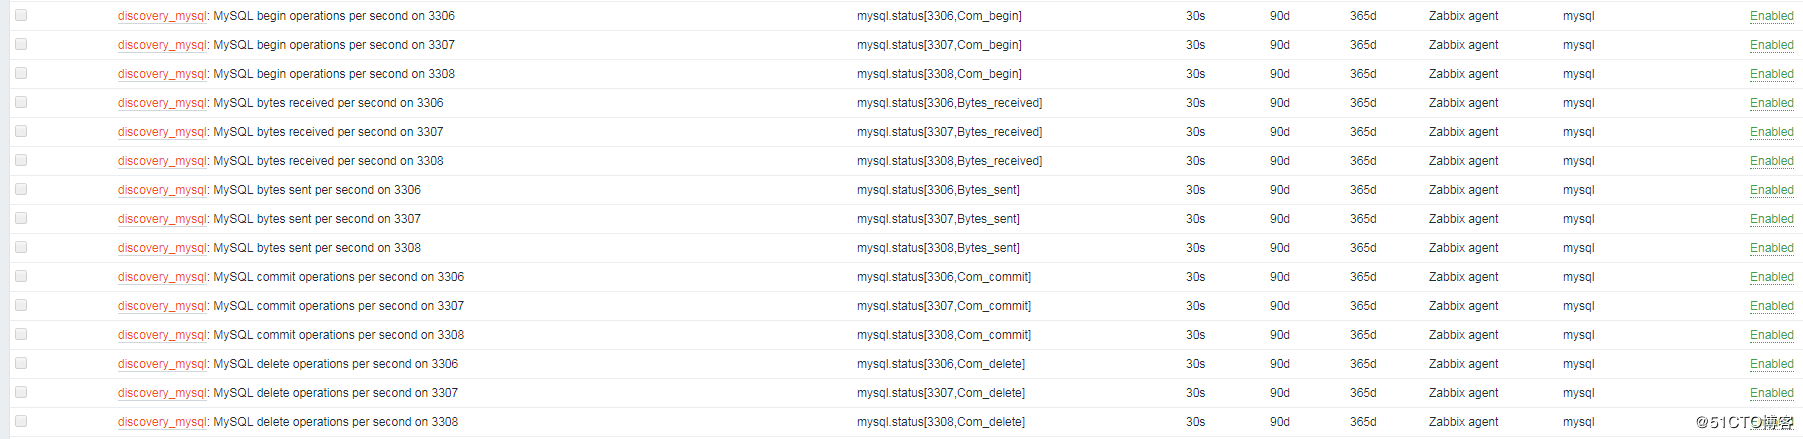
再查看Host中的item项,会多出以下监控项:
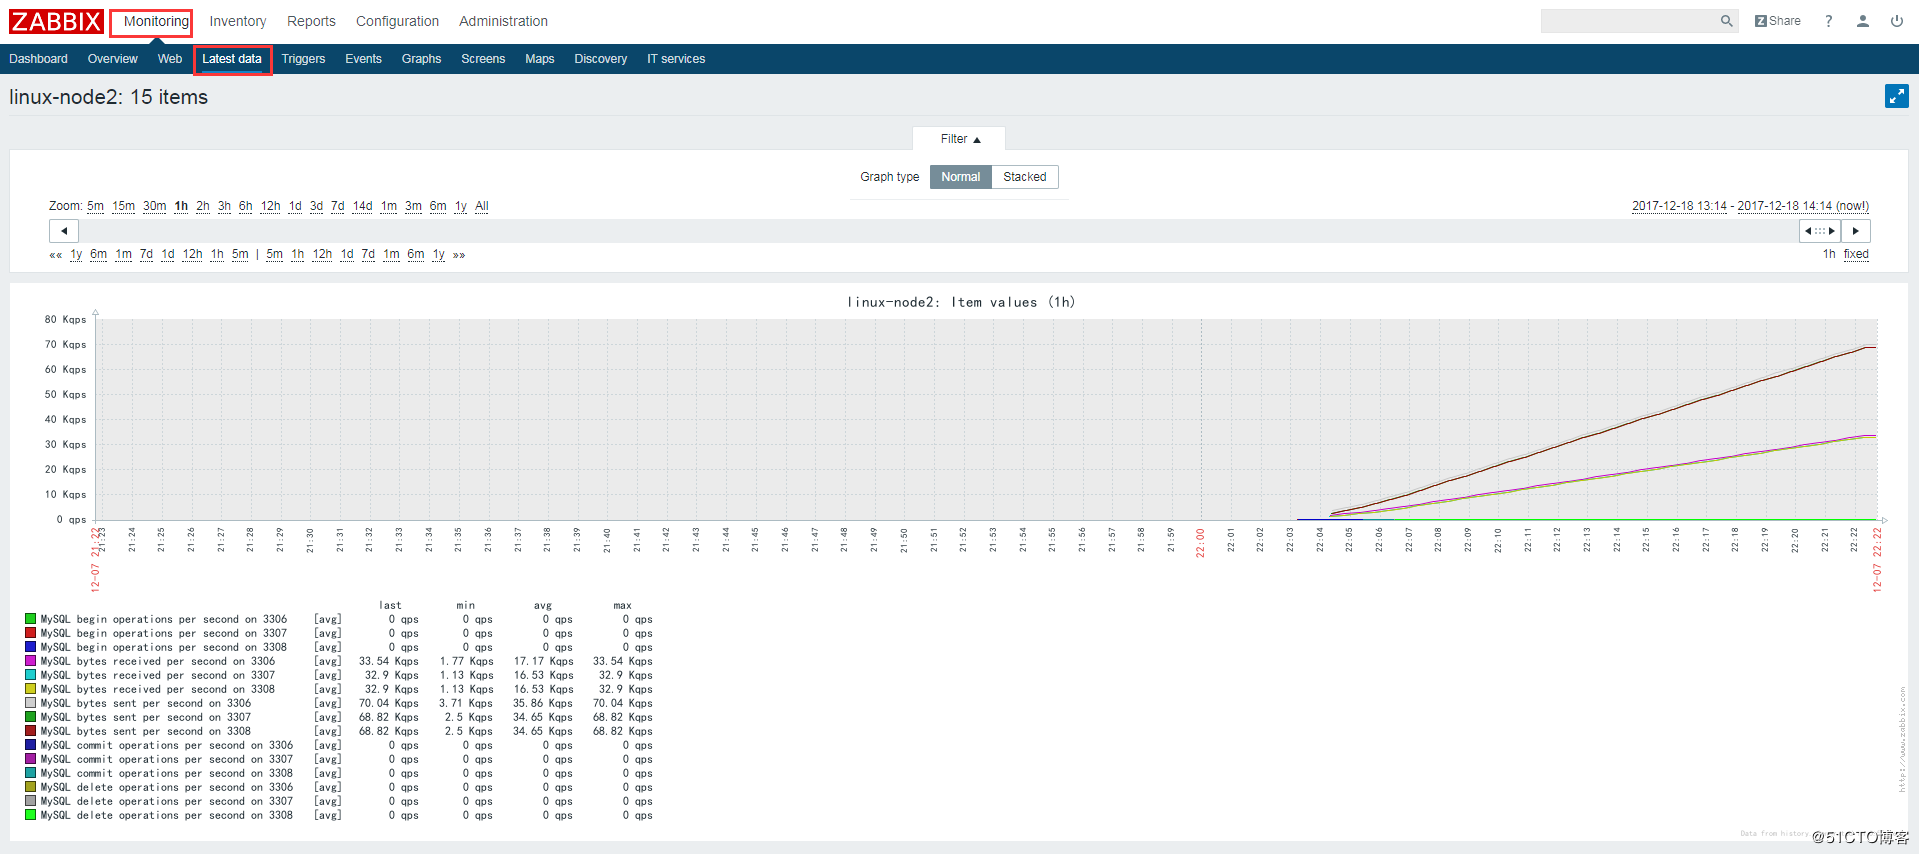
查看监控最新数据图表,即可看到3306、3307、3308的数据库状态信息:
################################################################################
-
1、Zabbix分布式监控
zabbix proxy 可以代替 zabbix server 检索客户端的数据,然后把数据汇报给 zabbix server,并且在一定程度上分担了zabbix server 的压力.zabbix proxy 可以非常简便的实现了集中式、分布式监控。
zabbix proxy 使用场景:
监控远程区域设备
监控本地网络不稳定区域
当 zabbix 监控上千设备时,使用它来减轻 server 的压力
简化 zabbix 的维护

Zabbix_proxy只需要一条tcp链接到zabbix_server,只需要配置一个防火墙规则。zabbix_proxy数据库必须和server分开,否则数据会被破坏。因为这两个数据库的表大部分相同。
Zabbix_proxy收集的所有数据在传输到服务器之前都存储在本地。然后再一定时间之后传递给zabbix_server。这个时间是由proxy配置文件中参数ProxyLocalBuffer and ProxyOfflineBuffer决定。
Zabbix_proxy是一个数据收集器。它不计算触发器,处理事件或发送警报。
备注:使用 agent active 模式,一定要记住在 agent 的配置文件参数 ServerActive 加上 proxy 的 IP 地址。
-
2、分布式部署
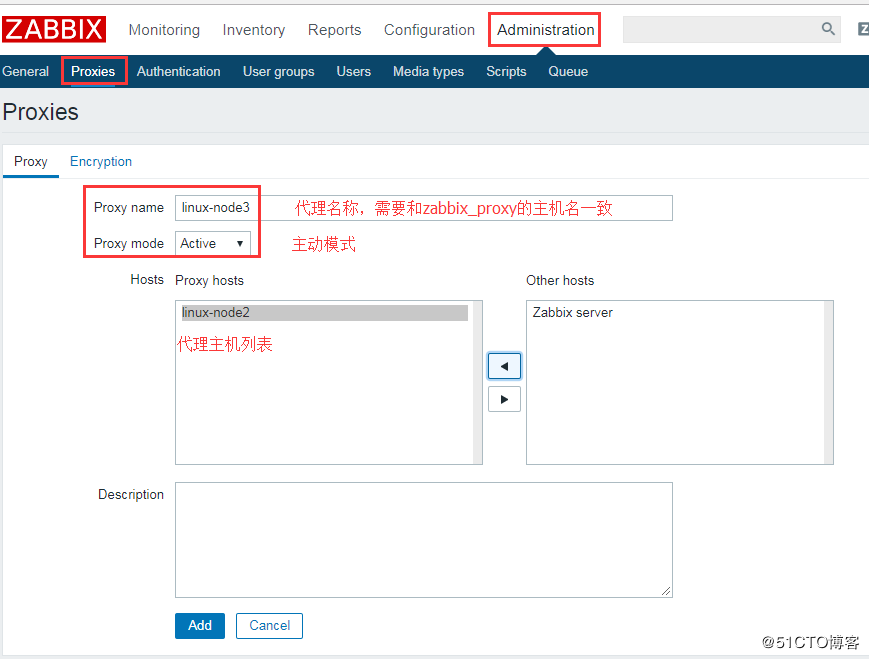
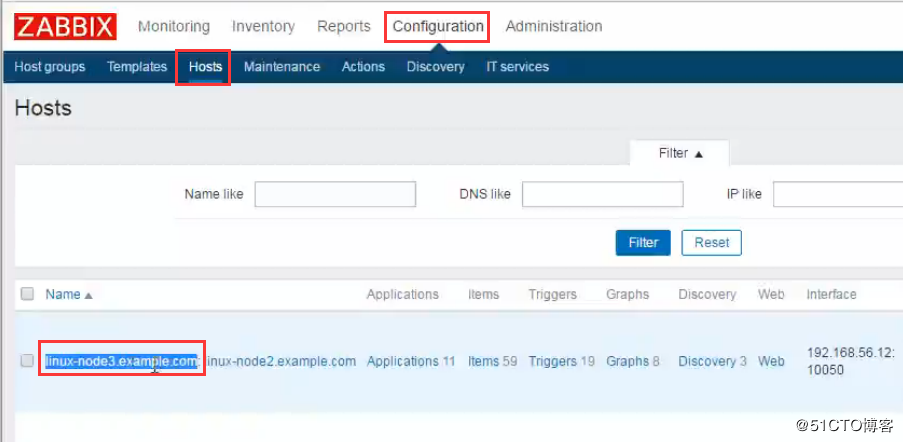
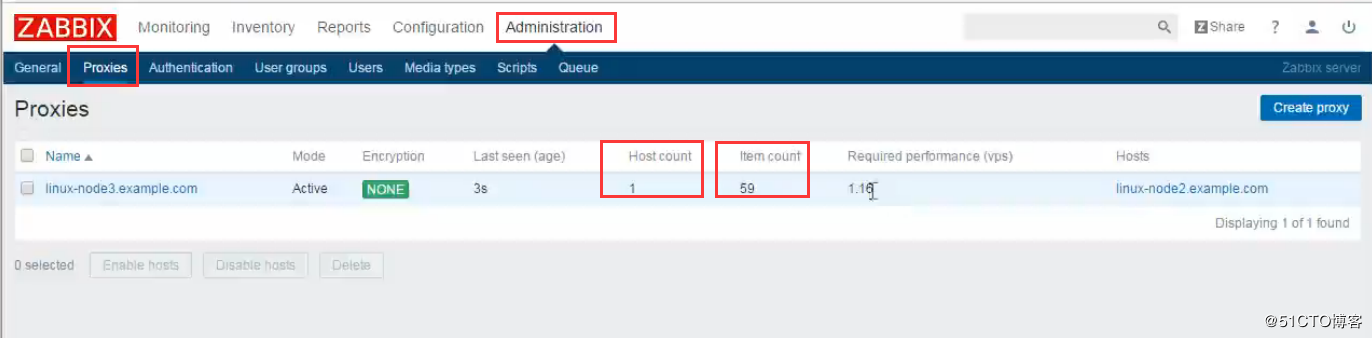
(1)安装zabbix-proxy-mysql和mariadb
[root@linux-node3 ~]# yum list|grep zabbix-proxy-mysql
[root@linux-node3 ~]# yum install -y zabbix-proxy-mysql
[root@linux-node3 ~]# yum install -y mariadb
[root@linux-node3 ~]# systemctl enable mariadb.service
[root@linux-node3 ~]# systemctl start mariadb.service

(2)创建zabbix_proxy库
[root@linux-node3 ~]# mysql
Welcome to the MariaDB monitor.  Commands end with ; or g.
Your MariaDB connection id is 11579
Server version: 5.5.56-MariaDB MariaDB Server

Copyright (c) 2000, 2017, Oracle, MariaDB Corporation Ab and others.

Type 'help;' or 'h' for help. Type 'c' to clear the current input statement.

MariaDB [(none)]> create database zabbix_proxy CHARATER set utf8 COLLATE utf8_bin;

MariaDB [(none)]> grant all on zabbix_proxy.* to zabbix@'localhost' identified by 'zabbix';

MariaDB [(none)]> exit;
Bye

(3)导入数据库
[root@linux-node3 ~]# rpm -ql zabbix-proxy-mysql
[root@linux-node3 ~]# zcat /usr/share/doc/zabbix-proxy-mysql-3.0.8/schema.sql.gz |mysql -uzabbix -pzabbix zabbix_proxy
[root@linux-node3 ~]# mysql -uzabbix -pzabbix -e "use zabbix_proxy;show tables;"

(4)修改zabbix_proxy配置文件
[root@linux-node3 ~]# vim /etc/zabbix/zabbix_proxy.conf
ProxyMode=0    #使用主动模式,1为被动模式,默认为主动模式,web前端也配置主动模式
Server=192.168.56.11    #填写zabbix-server的ip地址
ServerPort=10051        #zabbix的端口
HostnameItem=system.hostname
DBHost=localhost
DBName=zabbix_proxy
DBUser=zabbix
DBPassword=zabbix
Timeout=15

配置文件中没有配置的内容如下:(有需要可以配置)
# ProxyLocalBuffer=0
#数据保留的时间(小时为单位)
# ProxyOfflineBuffer=1
#连不上Server,数据要保留多久(小时为单位,默认1小时)
# DataSenderFrequency=1
#数据的发送时间间隔(默认是1秒)
# StartPollers=5
#启动的线程数
# StartIPMIPollers=0
#启动IPMI的线程数

(5)启动服务并检查端口
[root@linux-node3 ~]# systemctl start zabbix-proxy.service
[root@linux-node3 ~]# netstat -tulnp |grep 10051

(6)创建proxy
"Administration"-->"Proxies"-->"Create proxy"
(7)修改agent的配置
[root@linux-node2 ~]# grep "^[a-Z]" /etc/zabbix/zabbix_agentd.conf
PidFile=/var/run/zabbix/zabbix_agentd.pid
LogFile=/var/log/zabbix/zabbix_agentd.log
LogFileSize=0
DebugLevel=5
Server=192.168.56.13        #指向zabbix_proxy
ServerActive=192.168.56.13    #指向zabbix_proxy
HostnameItem=system.hostname
HostMetadata=web
Timeout=15
Include=/etc/zabbix/zabbix_agentd.d/*.conf
[root@linux-node2 ~]# systemctl restart zabbix-agent.service
-
3、交换机监控
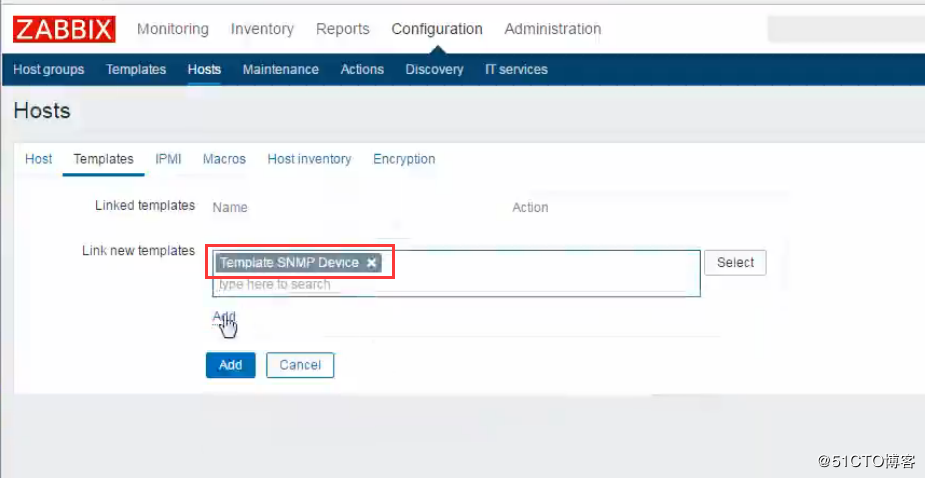
创建HOST,交换机监控
使用SNMP协议,思科默认端口为161。

添加zabbix的SNMP模板:
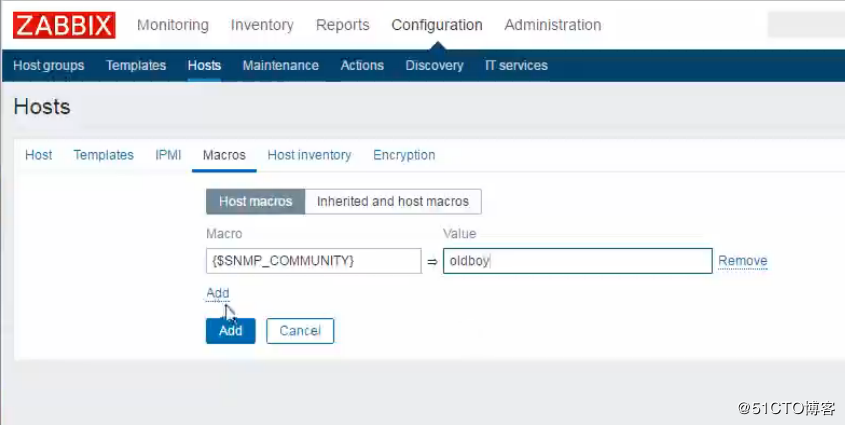
设置团体名:
{$SNMP_COMMUNITY}=团体名称