<%@ Page Language="C#" AutoEventWireup="true" CodeBehind="demo1.aspx.cs" Inherits="BaiduSDKDemo1203.EchartDemo.demo1" %>
<!DOCTYPE html PUBLIC "-//W3C//DTD XHTML 1.0 Transitional//EN" "http://www.w3.org/TR/xhtml1/DTD/xhtml1-transitional.dtd">
<html xmlns="http://www.w3.org/1999/xhtml">
<head runat="server">
<title>折线图</title>
</head>
<script src="../Scripts/jquery-1.4.1.js" type="text/javascript"></script>
<script src="../Scripts/echarts-all.js" type="text/javascript"></script>
<body>
<form id="form1" runat="server">
<div id="main" style=" 100%; height: 400px;">
</div>
</form>
</body>
</html>
<script type="text/javascript">
//本次示例所使用到的表格插件为Echarts,所使用的功能配置都是参见http://echarts.baidu.com/option.html#title
var myChart = echarts.init(document.getElementById('main'));
var option = {
tooltip: { //聚焦触发的效果,详情可参见。全局设置
trigger: 'axis',
axisPointer: {
type: 'cross',
crossStyle: {
color: '#f8f1ff'
}
}
},
legend: {
right: '',
data: ''
},
xAxis: [
{
type: '',
data: ''
}
],
yAxis: [],
series: [],
grid: { //设置网格属性
left: '10%', //网格距离容器左侧的距离
right: '10%', //网格距离容器右侧的距离
borderWidth: 1
}
};
$(function () {
$.ajax({
type: "post",
url: "/handler/Handler1.ashx",
data: { otype: "chart", chart: "heart" },
success: function (result) {
var jsonData = eval('(' + result + ')');
if (jsonData.statusCode == 10000) {
var xAxisdataJson = eval('(' + jsonData.Data + ')');
var xAxis = xAxisdataJson.xAxis;
var yAxis = xAxisdataJson.yAxis
var legend = xAxisdataJson.legend;
var series = xAxisdataJson.series; //数组
option.xAxis[0].type = xAxis != null ? xAxis.type : "";
option.xAxis[0].data = xAxis != null ? xAxis.data : "";
option.yAxis = yAxis;
option.series = series;
option.legend.right = legend.right;
option.legend.data = legend.data;
myChart.setOption(option);
}
else {
// myChart.setOption(option);
}
}
});
});
</script>
<script type="text/javascript">
//toolbox: { //图表容器的右上角工具栏
// feature: {
// dataView: {show: true, readOnly: false},
// magicType: {show: true, type: ['line', 'bar']},
// restore: {show: true},
// saveAsImage: {show: true}
// }
// },
//https://blog.csdn.net/weixin_40769819/article/details/105976287
//给echart的X轴和Y轴赋值:
//注意:标明xAxis和series的索引
//动态赋值
// var option = myChart.getOption();
// console.log(months);
// option.xAxis[0].data =months;
// option.series[0].data = drivingFootage;
// option.series[1].data = reclaimFootage;
// option.series[2].data = maintenanceFootage;
// myChart.setOption(option,true);
// series: [ //坐标轴实际数据内容
// {
// name:'降水量', //数据名称
// type:'bar', //数据表现形式(bar为柱形图,line为折线图)
// barWidth:'20%', //柱形图宽度
// itemStyle:{ //柱子的属性设置
// normal:{
// color: '#5fabff', //柱子的颜色设置
// }
// },
// data: [2.0, 2.2, 3.3, 4.5, 6.3, 10.2, 20.3, 23.4, 23.0, 16.5, 12.0, 6.2] //该条数据对应一条记录
// },
// {
// name:'蒸发量',
// type:'bar',
// barGap:'0%',
// barWidth:'20%',
// itemStyle:{
// normal:{
// color: '#25dfab',
// }
// },
// data: [2.0, 2.2, 3.3, 4.5, 6.3, 10.2, 20.3, 23.4, 23.0, 16.5, 12.0, 6.2]
// },
// {
// name:'温度',
// type:'line', //折线图
// yAxisIndex: 1,
// symbolSize: 10,
// itemStyle:{
// normal:{
// color: {
// type: 'linear',
// x: 0,
// y: 0,
// colorStops: [{ //渐变模式
// offset: 0, color: '#5fabff' // 0% 处的颜色 //折线开始的颜色
// }, {
// offset: 1, color: '#5fabff' // 100% 处的颜色 //折线结束的颜色,
// }],
// globalCoord: true // 缺省为 false
// },
// }
// },
// data:[2.0, 2.2, 3.3, 4.5, 6.3, 10.2, 20.3, 23.4, 23.0, 16.5, 12.0, 6.2]
// }
// ],
// yAxis: [ //(可以有多个坐标轴),数组中的对象位置决定了yAxisIndex的值(yAxisIndex会在series中用到)
// {
// type: 'value', //表示属性为value类
// name: '降水', //坐标轴名称
// minInterval: 1, //坐标最小划分单位,设置为1表示坐标轴节点保留整数
// splitNumber: 4, //指定坐标轴节点分割数(非强制),会按照预算自行调整最合适的分割数
// axisLine: { //表示坐标轴是否显示
// show: false
// },
// splitLine: { //表示分割线属性设置
// lineStyle: { //表示分割线的样式
// type: 'dashed' //虚线
// }
// },
// axisLabel: {
// formatter: '{value} ml' //表示所有值得单位
// }
// },
// {
// type: 'value',
// name: '温度',
// minInterval: 1,
// splitNumber: 4,
// splitLine: {
// show: false
// },
// axisLine: {
// show: false
// },
// axisLabel: {
// formatter: '{value} °C'
// }
// }
// ],
</script>
后台代码
using System;
using System.Collections.Generic;
using System.Linq;
using System.Web;
using Newtonsoft.Json;
namespace BaiduSDKDemo1203.handler
{
/// <summary>
/// Handler1 的摘要说明
/// </summary>
public class Handler1 : IHttpHandler
{
public void ProcessRequest(HttpContext context)
{
string otype = context.Request["otype"].ToString();
switch (otype)
{
case "chart":
InitEchart(context);
break;
}
}
public void InitEchart(HttpContext context)
{
string GUID = new Guid().ToString();
string chartType = context.Request["chart"].ToString();
string xAxisJson = "";
if (chartType == "heart")
{
#region 数据的组合
string arrayData = "1,2,3,4,5,6,7,8,9,10,11,12";
List<string> listdata = new List<string>();
xAxis xAxismodel = new xAxis();
xAxismodel.type = "category";
xAxismodel.data = arrayData.Split(',');
xAxisJson = JsonConvert.SerializeObject(xAxismodel);
T9.Util.LogUtil.WriteLog("InitEchart--xAxisJson:" + xAxisJson, "weblog");
axisLabel axisLabel = new axisLabel();
axisLabel.formatter = "{value} ml";
axisLabel axisLabel2 = new axisLabel();
axisLabel2.formatter = "{value} °C";
List<yAxis> listyAxis = new List<yAxis>();
yAxis yAxismodel = new yAxis();
yAxismodel.type = "value";
yAxismodel.name = "降水";
yAxismodel.axisLabel = axisLabel;
yAxis yAxismodel2 = new yAxis();
yAxismodel2.type = "value";
yAxismodel2.name = "温度";
yAxismodel2.axisLabel = axisLabel2;
listyAxis.Add(yAxismodel);
listyAxis.Add(yAxismodel2);
string legendData = "降水量,蒸发量,温度";
legend legend = new legend();
legend.right = "10%";
legend.data = legendData.Split(',');
List<series> listSeries = new List<series>();
string seriesData1 = "2.0,2.2,3.3, 4.5, 6.3, 10.2, 20.3, 23.4, 23.0, 16.5, 12.0, 6.2";
series seriesmodel = new series();
seriesmodel.name = "降水量";
seriesmodel.type = "bar";
seriesmodel.data = seriesData1.Split(',');
string seriesData2 = "2.0,2.2,3.3, 4.5, 6.3, 10.2, 20.3, 23.4, 23.0, 16.5, 12.0, 6.2";
series seriesmodel2 = new series();
seriesmodel2.name = "蒸发量";
seriesmodel2.type = "bar";
seriesmodel2.data = seriesData2.Split(',');
string seriesData3 = "2.0, 2.2, 3.3, 4.5, 6.3, 10.2, 20.3, 23.4, 23.0, 16.5, 12.0, 6.2";
series seriesmodel3 = new series();
seriesmodel3.name = "温度";
seriesmodel3.type = "line";
seriesmodel3.data = seriesData3.Split(',');
listSeries.Add(seriesmodel);
listSeries.Add(seriesmodel2);
listSeries.Add(seriesmodel3);
#endregion
echartModel echartModel = new echartModel();
echartModel.xAxis = xAxismodel;
echartModel.yAxis = listyAxis;
echartModel.legend = legend;
echartModel.series = listSeries;
string echartJson = JsonConvert.SerializeObject(echartModel);
T9.Util.LogUtil.WriteLog("InitEchart--echartJson:" + echartJson, "weblog");
CommonResponse(context, GUID, chartType, 10000, echartJson, "获取数据成功", "weblog");
return;
}
}
#region 交互通用返回函数
/// <summary>
/// 交互通用返回函数
/// </summary>
/// <param name="context"></param>
/// <param name="GUID"></param>
/// <param name="otype"></param>
/// <param name="statusCode">
/// 10000 正常
/// 9999 系统异常
/// 9998 接口参数接收异常
/// 9997 内部逻辑校验未通过
/// 9996 内部业务执行失败
/// 9995 请求接口超时
/// 9990 接口暂未开放
/// </param>
/// <param name="Data"></param>
/// <param name="Message"></param>
public static void CommonResponse(HttpContext context, string GUID, string otype, int statusCode, string Data, string Message, string logName)
{
RESPONSEMODEL response = new RESPONSEMODEL();
response.statusCode = statusCode;
response.Data = Data;
if (!string.IsNullOrWhiteSpace(Message))
{
response.message = Message;
}
string jsonResult = JsonConvert.SerializeObject(response); //T9.Util.JSONUtil.JsonSerializer(response);
T9.Util.LogUtil.WriteLog("CODE=" + GUID + "
动作:" + otype + "
结果:" + jsonResult, logName);
context.Response.Write(jsonResult);
}
#endregion
#region datetime转换为unixtime
public static int ConvertDateTimeInt(System.DateTime time)
{
System.DateTime startTime = TimeZone.CurrentTimeZone.ToLocalTime(new System.DateTime(1970, 1, 1));
return (int)(time - startTime).TotalSeconds;
}
#endregion
#region 交互通用返回
/// <summary>
/// ajax 返回通用对象
/// </summary>
[Serializable]
public class RESPONSEMODEL
{
public RESPONSEMODEL()
{
statusCode = 0;
message = null;
Data = null;
}
/// <summary>
/// statusCode
/// 10000:数据交互正常
/// 9999:系统异常
/// 9998:参数异常
/// 9997:用户信息校验失败
/// 9996:时间戳超时
/// 9995:签名有误
/// 9991:提交失败
/// 9990:无数据
/// :其他业务内的状态标识,用998_来表示
/// </summary>
public int statusCode { get; set; }
public string message { get; set; }
public string Data { get; set; }
}
/// <summary>
/// 交互通用返回
/// </summary>
/// <param name="context"></param>
/// <param name="UID"></param>
/// <param name="otype"></param>
/// <param name="statusCode">
/// 10000:数据交互正常
/// 9999:系统异常
/// 9998:参数异常
/// 9997:用户信息校验失败
/// 9996:时间戳超时
/// 9995:签名有误
/// 9991:提交失败
/// 9990:无数据
/// :其他业务内的状态标识,用998_来表示
/// </param>
/// <param name="Message"></param>
/// <param name="Data"></param>
public static void CommonResponse(HttpContext context, int UID, string otype, string GUID, int statusCode, string Message, string Data, string logName)
{
RESPONSEMODEL response = new RESPONSEMODEL();
response.statusCode = statusCode;
if (!string.IsNullOrWhiteSpace(Message))
{
response.message = Message;
}
if (!string.IsNullOrWhiteSpace(Data))
{
response.Data = Data; //"{"third_Session":"" + third_Session + ""}";
}
string jsonResult = T9.Util.JSONUtil.JsonSerializer(response);
T9.Util.LogUtil.WriteLog("GUID=" + GUID + "
动作=" + otype + "
用户ID:" + UID + "
结果:" + jsonResult, logName);
context.Response.Write(jsonResult);
}
#endregion
#region echartModel通用实体类
public class echartModel
{
public legend legend { get; set; }
public xAxis xAxis { get; set; }
public List<yAxis> yAxis { get; set; }
public List<series> series { get; set; }
}
public class legend
{
public string right { get; set; }
public string[] data { get; set; }
}
public class xAxis
{
public string type { get; set; }
public string[] data { get; set; }
}
public class series
{
public string name { get; set; }
public string type { get; set; }
public string[] data { get; set; }
}
public class yAxis
{
public string type { get; set; }
public string name { get; set; }
public axisLabel axisLabel { get; set; }
}
public class axisLabel
{
public string formatter { get; set; }
}
#endregion
public bool IsReusable
{
get
{
return false;
}
}
}
}
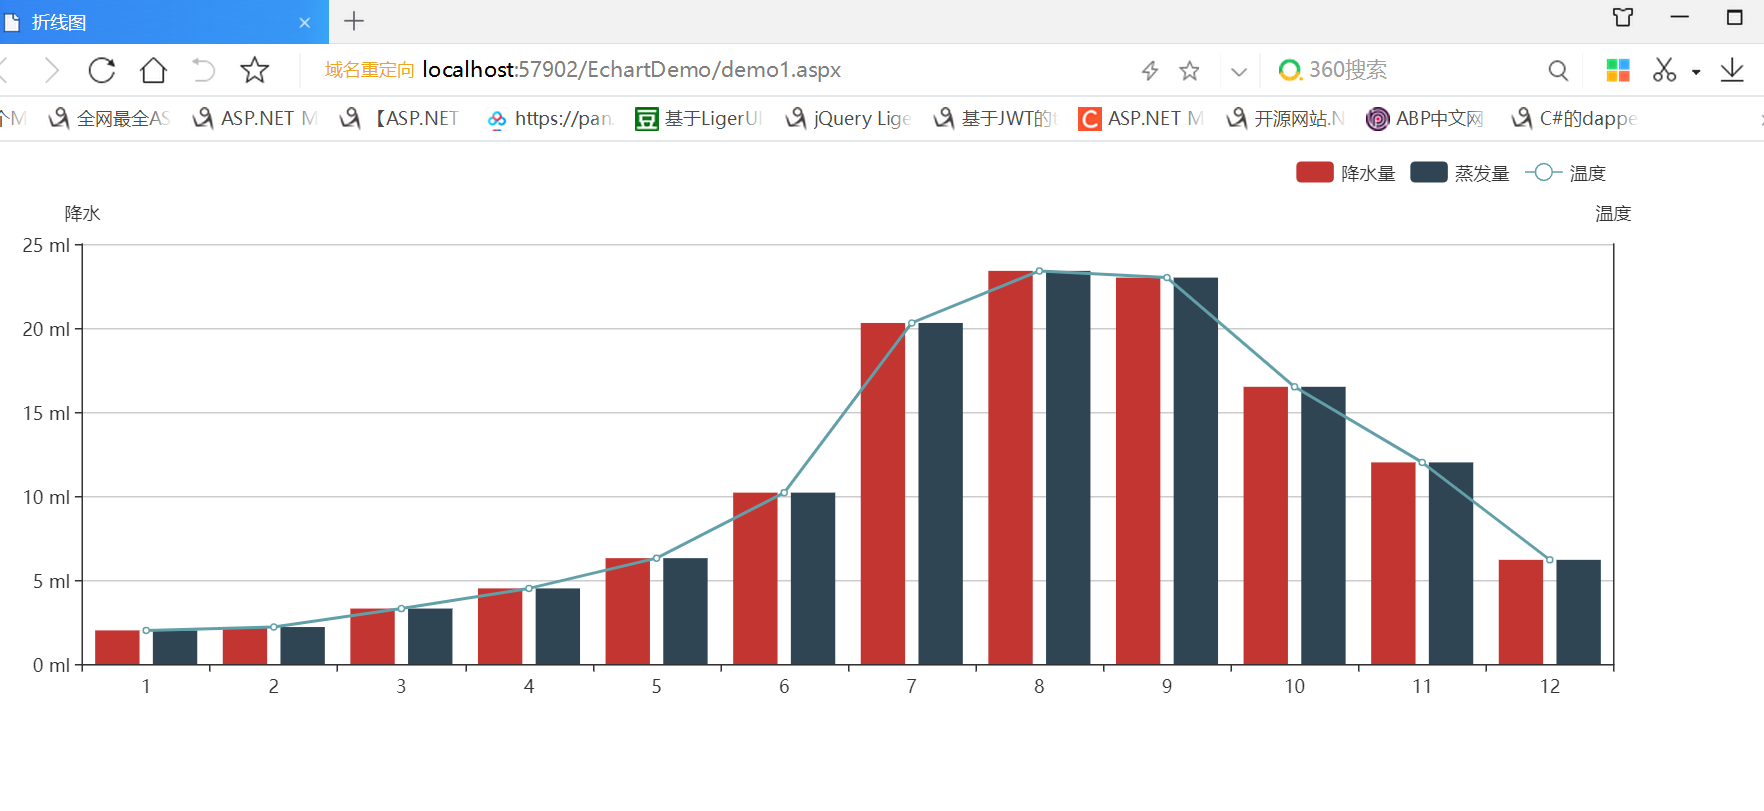
效果图: