Docker安装kibana
参考博客:
https://www.cnblogs.com/wenhuazzz/p/12055747.html
感谢这位老哥让我解决了坑点
一、获取镜像
docker pull kibana:7.6.1
这里的版本号选择自己要用的,一般与es的相同
二、启动
docker run --name mykibana -e ELASTICSEARCH_URL = http://x.x.x.x:9200 -p 5601:5601 -d kibana:7.6.1
说明:
x.x.x.x是你的ip地址
坑点
巨坑!!!
被坑了好久。
网络搜索的docker安装kibana的版本可能较低,按照上述命令run之后,容器能够正常运行,但是日志会一直报错!访问页面也会连不上。
报错:
{"type":"log","@timestamp":"2019-12-13T07:33:15Z","tags":["info","plugins-system"],"pid":6,"message":"Setting up [15] plugins: [timelion,features,security,licensing,spaces,code,uiActions,newsfeed,translations,inspector,embeddable,advancedUiActions,data,expressions,eui_utils]"}
{"type":"log","@timestamp":"2019-12-13T07:33:15Z","tags":["info","plugins","timelion"],"pid":6,"message":"Setting up plugin"}
{"type":"log","@timestamp":"2019-12-13T07:33:15Z","tags":["info","plugins","features"],"pid":6,"message":"Setting up plugin"}
{"type":"log","@timestamp":"2019-12-13T07:33:15Z","tags":["info","plugins","security"],"pid":6,"message":"Setting up plugin"}
{"type":"log","@timestamp":"2019-12-13T07:33:15Z","tags":["warning","plugins","security","config"],"pid":6,"message":"Generating a random key for xpack.security.encryptionKey. To prevent sessions from being invalidated on restart, please set xpack.security.encryptionKey in kibana.yml"}
{"type":"log","@timestamp":"2019-12-13T07:33:15Z","tags":["warning","plugins","security","config"],"pid":6,"message":"Session cookies will be transmitted over insecure connections. This is not recommended."}
{"type":"log","@timestamp":"2019-12-13T07:33:15Z","tags":["info","plugins","licensing"],"pid":6,"message":"Setting up plugin"}
{"type":"log","@timestamp":"2019-12-13T07:33:15Z","tags":["info","plugins","spaces"],"pid":6,"message":"Setting up plugin"}
{"type":"log","@timestamp":"2019-12-13T07:33:15Z","tags":["info","plugins","code"],"pid":6,"message":"Setting up plugin"}
{"type":"log","@timestamp":"2019-12-13T07:33:15Z","tags":["info","plugins","translations"],"pid":6,"message":"Setting up plugin"}
{"type":"log","@timestamp":"2019-12-13T07:33:15Z","tags":["info","plugins","data"],"pid":6,"message":"Setting up plugin"}
{"type":"log","@timestamp":"2019-12-13T07:33:40Z","tags":["error","elasticsearch","data"],"pid":6,"message":"Request error, retrying
GET http://elasticsearch:9200/_xpack => getaddrinfo ENOTFOUND elasticsearch elasticsearch:9200"}
{"type":"log","@timestamp":"2019-12-13T07:33:41Z","tags":["warning","elasticsearch","data"],"pid":6,"message":"Unable to revive connection: http://elasticsearch:9200/"}
{"type":"log","@timestamp":"2019-12-13T07:33:41Z","tags":["warning","elasticsearch","data"],"pid":6,"message":"No living connections"}
{"type":"log","@timestamp":"2019-12-13T07:33:41Z","tags":["warning","plugins","licensing"],"pid":6,"message":"License information could not be obtained from Elasticsearch for the [data] cluster. Error: No Living connections"}
{"type":"log","@timestamp":"2019-12-13T07:33:41Z","tags":["warning","legacy-plugins"],"pid":6,"path":"/usr/share/kibana/src/legacy/core_plugins/visualizations","message":"Skipping non-plugin directory at /usr/share/kibana/src/legacy/core_plugins/visualizations"}
{"type":"log","@timestamp":"2019-12-13T07:33:42Z","tags":["info","plugins-system"],"pid":6,"message":"Starting [8] plugins: [timelion,features,security,licensing,spaces,code,translations,data]"}
{"type":"log","@timestamp":"2019-12-13T07:33:42Z","tags":["error","elasticsearch","admin"],"pid":6,"message":"Request error, retrying
GET http://elasticsearch:9200/.kibana_task_manager => getaddrinfo ENOTFOUND elasticsearch elasticsearch:9200"}
{"type":"log","@timestamp":"2019-12-13T07:33:42Z","tags":["error","elasticsearch","admin"],"pid":6,"message":"Request error, retrying
GET http://elasticsearch:9200/.kibana => getaddrinfo ENOTFOUND elasticsearch elasticsearch:9200"}
{"type":"log","@timestamp":"2019-12-13T07:33:42Z","tags":["warning","elasticsearch","admin"],"pid":6,"message":"Unable to revive connection: http://elasticsearch:9200/"}
{"type":"log","@timestamp":"2019-12-13T07:33:42Z","tags":["warning","elasticsearch","admin"],"pid":6,"message":"No living connections"}
{"type":"log","@timestamp":"2019-12-13T07:33:42Z","tags":["warning","migrations"],"pid":6,"message":"Unable to connect to Elasticsearch. Error: No Living connections"}
{"type":"log","@timestamp":"2019-12-13T07:33:42Z","tags":["warning","elasticsearch","admin"],"pid":6,"message":"Unable to revive connection: http://elasticsearch:9200/"}
{"type":"log","@timestamp":"2019-12-13T07:33:42Z","tags":["warning","elasticsearch","admin"],"pid":6,"message":"No living connections"}
{"type":"log","@timestamp":"2019-12-13T07:33:44Z","tags":["warning","elasticsearch","admin"],"pid":6,"message":"Unable to revive connection: http://elasticsearch:9200/"}
{"type":"log","@timestamp":"2019-12-13T07:33:44Z","tags":["warning","elasticsearch","admin"],"pid":6,"message":"No living connections"}
{"type":"log","@timestamp":"2019-12-13T07:33:46Z","tags":["warning","elasticsearch","data"],"pid":6,"message":"Unable to revive connection: http://elasticsearch:9200/"}
{"type":"log","@timestamp":"2019-12-13T07:33:46Z","tags":["warning","elasticsearch","data"],"pid":6,"message":"No living connections"}
{"type":"log","@timestamp":"2019-12-13T07:33:46Z","tags":["warning","plugins","licensing"],"pid":6,"message":"License information could not be obtained from Elasticsearch for the [data]
["error","elasticsearch","data"],"pid":6,"message":"Request error, retrying
GET http://elasticsearch:9200/_xpack => getaddrinfo ENOTFOUND elasticsearch elasticsearch:9200"}
核心就是这一句话,es根本就没有访问到。这是因为里面的配置文件有问题,需要进行修正。
修改/usr/share/kibana/config/kibana.yml
这是修改后的内容,要将elasticsearch.hosts中的内容改为容器的ip地址(原本是elasticsearch)
docker inspect 容器id(或容器名字) |grep IPAddress查找容器ip
[root@iZ1ejkkkxu2looZ ~]# docker inspect myes01  |grep IPAddress
            "SecondaryIPAddresses": null,
            "IPAddress": "172.17.0.2",
                    "IPAddress": "172.17.0.2",
然后xpack.monitoring.ui.container.elasticsearch.enabled改为true
#
# ** THIS IS AN AUTO-GENERATED FILE **
#

# Default Kibana configuration for docker target
server.name: kibana
server.host: "0"
elasticsearch.hosts: [ "http://172.17.0.2:9200" ]
xpack.monitoring.ui.container.elasticsearch.enabled: false
然后在宿主机将容器restart即可
docker restart 容器id
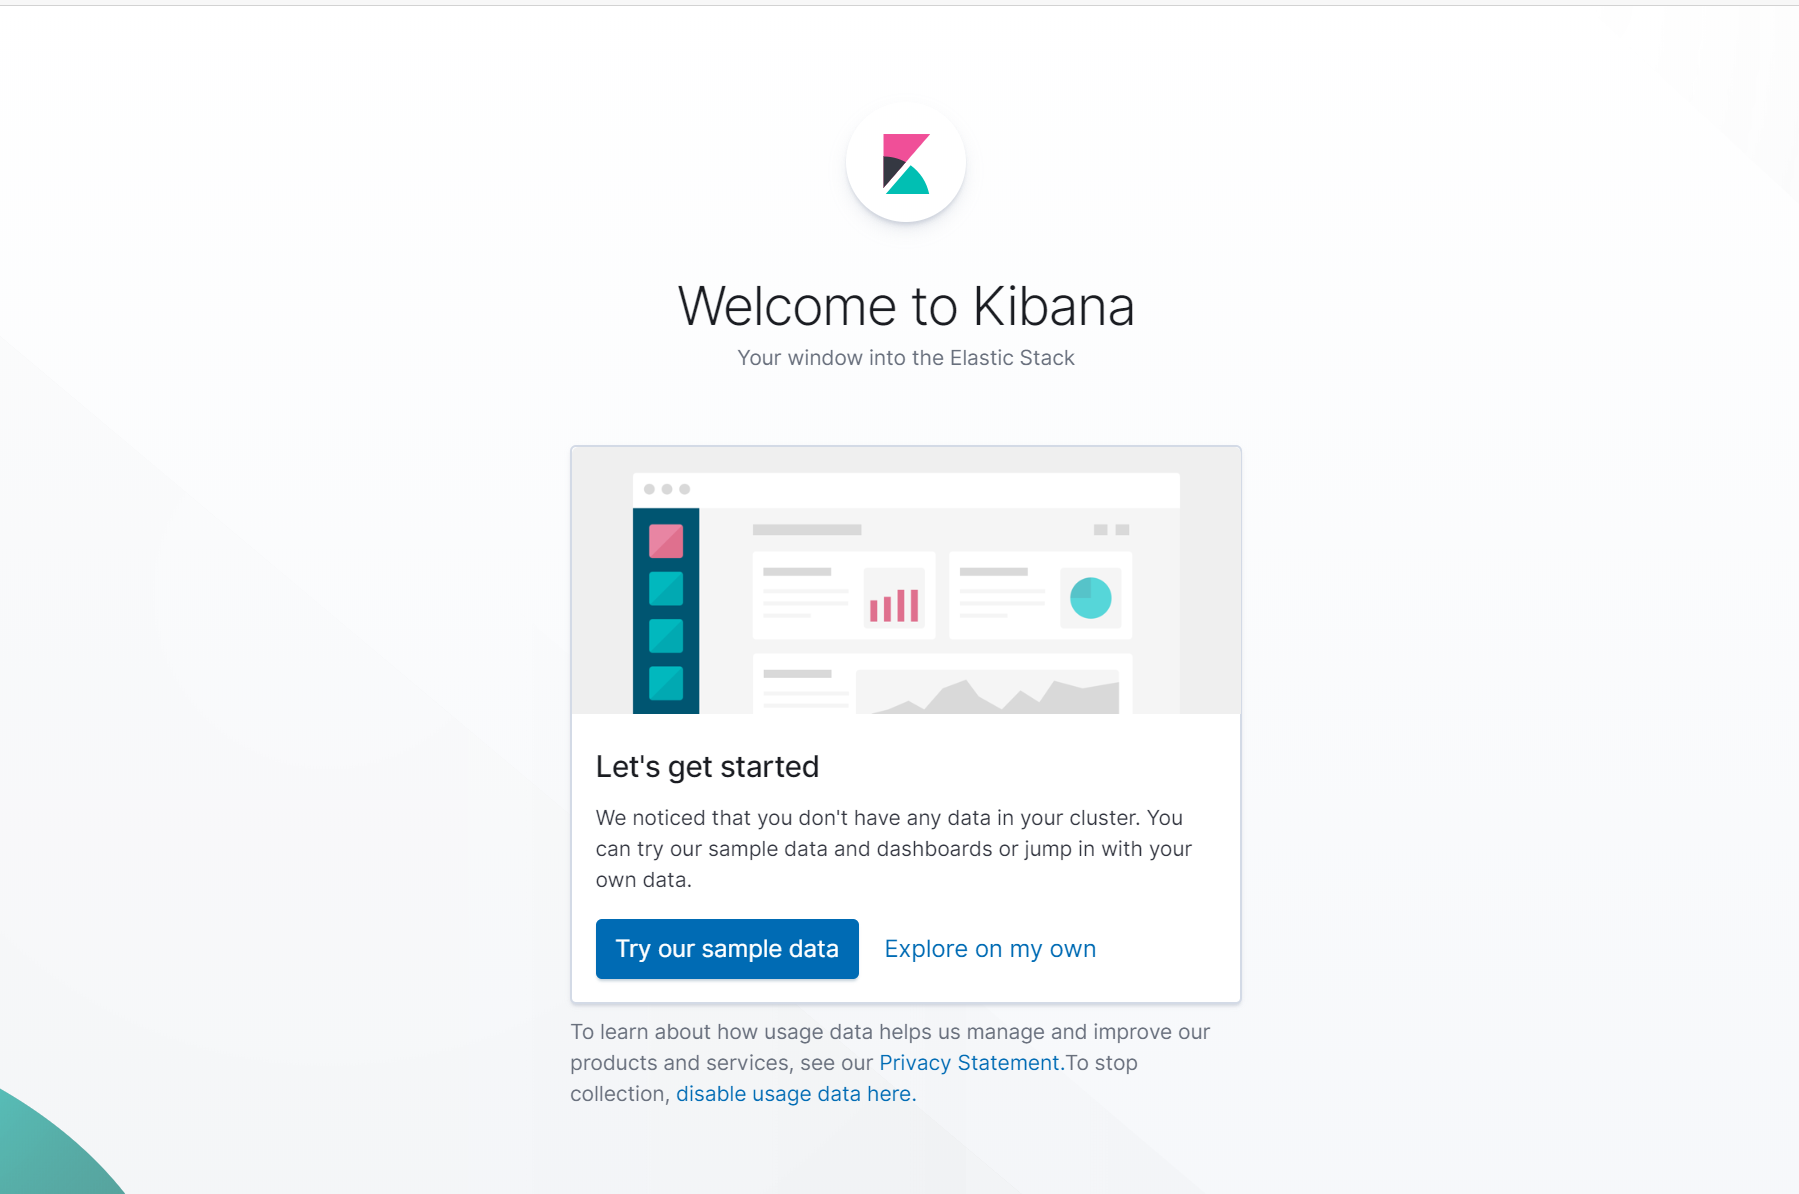
三、访问
访问http://101.37.173.195:5601 完成撒花~