学习了两个多月的PeopleSoft,感觉刚刚摸到了门槛,可惜目前没有项目,没有可以更深入学习的机会,此时手头上接到一个JAVA的项目 ̄□ ̄||,但总算不用早上搞PeopleSoft,晚上搞JAVA(身心疲惫啊),相信以后的进度会有所提升。感谢老师一直以来的指导,让我有了更加明确的目标,以后还要更加努力才行!!!
标题组件
标题负责显示整个图表的标题
1.Text:标题文字
2.Subtext:子标题
3.Left,top,right,bottom标题的位置
4.borderColor:边框颜色
5.borderWidth:边框宽度
(只列举几个常用的属性,查看官方文档更加全面)
工具栏组件
组件的工具栏
1.Show:是否显示
2.Feature:具体显示的功能
3.saveAsImage:保存图片
4.Restore:还原
5.dataView:数据视图
6.dataZoom:缩放视图
7.magicType:动态类型切换
tooltip组件
弹窗组件
1.Show:是否显示
2.Trigger:触发方式,axis就是x轴触发
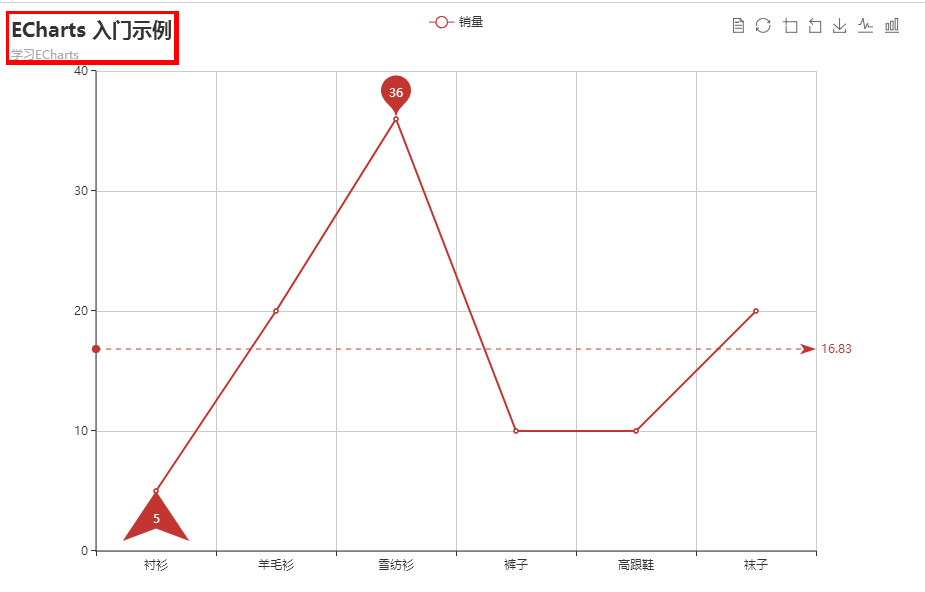
标记线和标记点
1.标记线:markline
标记线的添加
最大值,平均值,最小值的标记线
2.标记点:markpoint
标记点的添加
最大值,品均值,最小值的标记点
任意位置的标记点
示例:
<!DOCTYPE html>
<html>
<head>
    <meta charset="utf-8">
    <title>ECharts</title>
    <!-- 引入 echarts.js -->
    <script src="../echarts.min.js"></script>
</head>
<body>
    <!-- 为ECharts准备一个具备大小(宽高)的Dom -->
<div id="main" style=" 900px;height:600px;"></div>
<script type="text/javascript">
        // 基于准备好的dom,初始化echarts实例
var myChart = echarts.init(document.getElementById('main'));

// 指定图表的配置项和数据
var option = {
    title: {
        show:true,
        text: 'ECharts 入门示例',
        subtext:'学习ECharts',
        left:'left', // 数字就是像素值 ,也可以是 center left right这种值
        borderColor:'red',
        borderWidth:5,
        textStyle:{
            fontSize:20
        }
    },
    toolbox: {
        show: true,
        feature: {
            dataView:{
                show:true
            },
            restore:{
                show:true
            },
            dataZoom:{
                show:true
            },
            saveAsImage: {
                show: true
            },
            magicType: {
                type: ['line', 'bar']
            }
        }
    },
    tooltip: {
        trigger: 'axis'
    },
    legend: {
        data: ['销量']
    },
    xAxis: {
        data: ["衬衫", "羊毛衫", "雪纺衫", "裤子", "高跟鞋", "袜子"]
    },
    yAxis: {},
    series: [{
        name: '销量',
        type: 'line',
        data: [5, 20, 36, 10, 10, 20],
        markPoint: {
            data: [
                {type: 'max', name: '最大值'},
                {type: 'min', name: '最小值',symbol:'arrow'}
            ]
        },
        markLine: {
            data: [
                {type: 'average', name: '平均值'}
            ]
        }
    }]
};

// 使用刚指定的配置项和数据显示图表。
myChart.setOption(option);
</script>
</body>
</html>
效果:
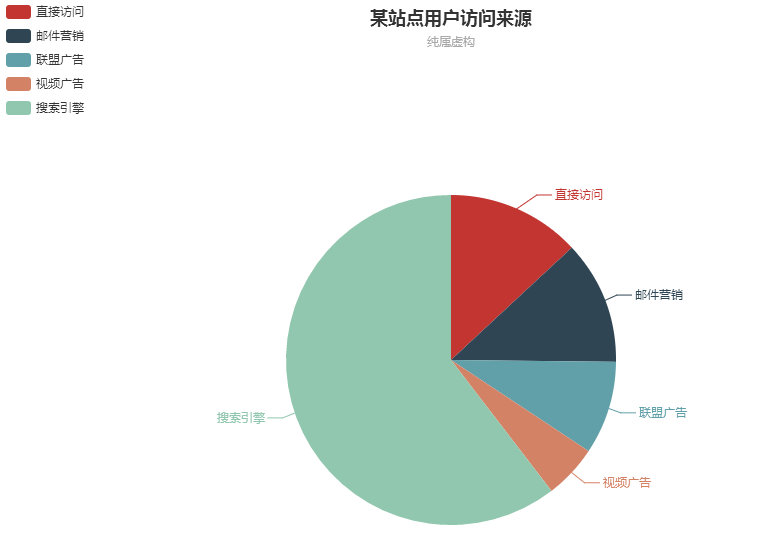
饼图
1.饼图展示数据的特点
展示百分比
Type是pie
2.Center圆心坐标
3.Radius半径
4.Name图例名字
5.selectedMode是否支持多选
示例:
<!DOCTYPE html>
<html>
<head>
    <meta charset="utf-8">
    <title>ECharts</title>
    <!-- 引入 echarts.js -->
    <script src="../echarts.min.js"></script>
</head>
<body>
    <!-- 为ECharts准备一个具备大小(宽高)的Dom -->
<div id="main" style=" 900px;height:600px;"></div>
<script type="text/javascript">
        // 基于准备好的dom,初始化echarts实例
var myChart = echarts.init(document.getElementById('main'));

// 指定图表的配置项和数据
var option = {
    title : {
        text: '某站点用户访问来源',
        subtext: '纯属虚构',
        x:'center'
    },
    tooltip : {
        trigger: 'item',
        formatter: "{a} <br/>{b} : {c} ({d}%)"
    },
    legend: {
        orient: 'vertical',
        left: 'left',
        data: ['直接访问','邮件营销','联盟广告','视频广告','搜索引擎']
    },
    series : [
        {
            name: '访问来源',
            type: 'pie',
            radius : '55%',
            center: ['50%', '60%'],
            data:[
                {value:335, name:'直接访问'},
                {value:310, name:'邮件营销'},
                {value:234, name:'联盟广告'},
                {value:135, name:'视频广告'},
                {value:1548, name:'搜索引擎'}
            ]
        }
    ]
};

// 使用刚指定的配置项和数据显示图表。
myChart.setOption(option);
</script>
</body>
</html>
效果:
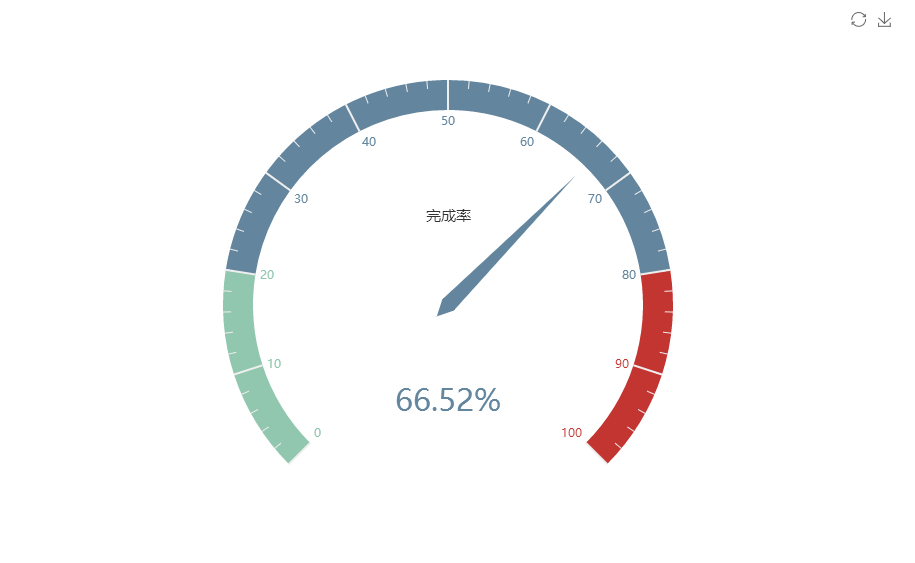
仪表图
1.仪表图展示数据特点
Type是gauge
2.动态修改仪表图数据
示例:
<!DOCTYPE html>
<html>
<head>
    <meta charset="utf-8">
    <title>ECharts</title>
    <!-- 引入 echarts.js -->
    <script src="../echarts.min.js"></script>
</head>
<body>
    <!-- 为ECharts准备一个具备大小(宽高)的Dom -->
<div id="main" style=" 900px;height:600px;"></div>
<script type="text/javascript">
        // 基于准备好的dom,初始化echarts实例
var myChart = echarts.init(document.getElementById('main'));

// 指定图表的配置项和数据
var option = {
    tooltip : {
        formatter: "{a} <br/>{b} : {c}%"
    },
    toolbox: {
        feature: {
            restore: {},
            saveAsImage: {}
        }
    },
    series: [
        {
            name: '业务指标',
            type: 'gauge',
            detail: {formatter:'{value}%'},
            data: [{value: 32, name: '完成率'}]
        }
    ]
};


// 使用刚指定的配置项和数据显示图表。
myChart.setOption(option);
setInterval(function () {
    option.series[0].data[0].value = (Math.random() * 100).toFixed(2) - 0;
    myChart.setOption(option, true);
},2000);
</script>
</body>
</html>
效果:
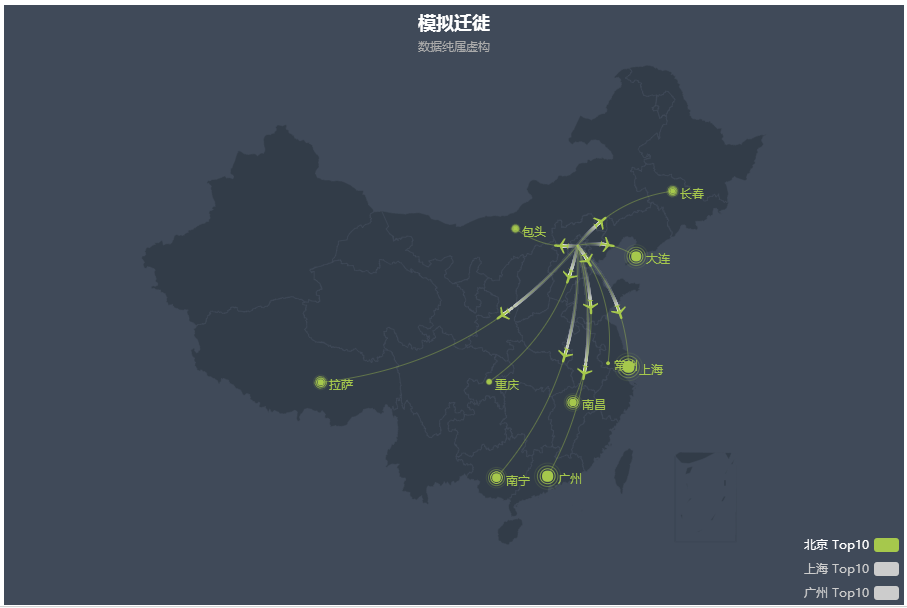
地图:
示例:
<!DOCTYPE html>
<html>
<head>
    <meta charset="utf-8">
    <title>ECharts</title>
    <!-- 引入 echarts.js -->
    <script src="../echarts.min.js"></script>
    <script src="../china.js"></script>
</head>
<body>
    <!-- 为ECharts准备一个具备大小(宽高)的Dom -->
<div id="main" style=" 900px;height:600px;"></div>
<script type="text/javascript">
        // 基于准备好的dom,初始化echarts实例
var myChart = echarts.init(document.getElementById('main'));
var geoCoordMap = {
    '上海': [121.4648,31.2891],
    '东莞': [113.8953,22.901],
    '东营': [118.7073,37.5513],
    '中山': [113.4229,22.478],
    '临汾': [111.4783,36.1615],
    '临沂': [118.3118,35.2936],
    '丹东': [124.541,40.4242],
    '丽水': [119.5642,28.1854],
    '乌鲁木齐': [87.9236,43.5883],
    '佛山': [112.8955,23.1097],
    '保定': [115.0488,39.0948],
    '兰州': [103.5901,36.3043],
    '包头': [110.3467,41.4899],
    '北京': [116.4551,40.2539],
    '北海': [109.314,21.6211],
    '南京': [118.8062,31.9208],
    '南宁': [108.479,23.1152],
    '南昌': [116.0046,28.6633],
    '南通': [121.1023,32.1625],
    '厦门': [118.1689,24.6478],
    '台州': [121.1353,28.6688],
    '合肥': [117.29,32.0581],
    '呼和浩特': [111.4124,40.4901],
    '咸阳': [108.4131,34.8706],
    '哈尔滨': [127.9688,45.368],
    '唐山': [118.4766,39.6826],
    '嘉兴': [120.9155,30.6354],
    '大同': [113.7854,39.8035],
    '大连': [122.2229,39.4409],
    '天津': [117.4219,39.4189],
    '太原': [112.3352,37.9413],
    '威海': [121.9482,37.1393],
    '宁波': [121.5967,29.6466],
    '宝鸡': [107.1826,34.3433],
    '宿迁': [118.5535,33.7775],
    '常州': [119.4543,31.5582],
    '广州': [113.5107,23.2196],
    '廊坊': [116.521,39.0509],
    '延安': [109.1052,36.4252],
    '张家口': [115.1477,40.8527],
    '徐州': [117.5208,34.3268],
    '德州': [116.6858,37.2107],
    '惠州': [114.6204,23.1647],
    '成都': [103.9526,30.7617],
    '扬州': [119.4653,32.8162],
    '承德': [117.5757,41.4075],
    '拉萨': [91.1865,30.1465],
    '无锡': [120.3442,31.5527],
    '日照': [119.2786,35.5023],
    '昆明': [102.9199,25.4663],
    '杭州': [119.5313,29.8773],
    '枣庄': [117.323,34.8926],
    '柳州': [109.3799,24.9774],
    '株洲': [113.5327,27.0319],
    '武汉': [114.3896,30.6628],
    '汕头': [117.1692,23.3405],
    '江门': [112.6318,22.1484],
    '沈阳': [123.1238,42.1216],
    '沧州': [116.8286,38.2104],
    '河源': [114.917,23.9722],
    '泉州': [118.3228,25.1147],
    '泰安': [117.0264,36.0516],
    '泰州': [120.0586,32.5525],
    '济南': [117.1582,36.8701],
    '济宁': [116.8286,35.3375],
    '海口': [110.3893,19.8516],
    '淄博': [118.0371,36.6064],
    '淮安': [118.927,33.4039],
    '深圳': [114.5435,22.5439],
    '清远': [112.9175,24.3292],
    '温州': [120.498,27.8119],
    '渭南': [109.7864,35.0299],
    '湖州': [119.8608,30.7782],
    '湘潭': [112.5439,27.7075],
    '滨州': [117.8174,37.4963],
    '潍坊': [119.0918,36.524],
    '烟台': [120.7397,37.5128],
    '玉溪': [101.9312,23.8898],
    '珠海': [113.7305,22.1155],
    '盐城': [120.2234,33.5577],
    '盘锦': [121.9482,41.0449],
    '石家庄': [114.4995,38.1006],
    '福州': [119.4543,25.9222],
    '秦皇岛': [119.2126,40.0232],
    '绍兴': [120.564,29.7565],
    '聊城': [115.9167,36.4032],
    '肇庆': [112.1265,23.5822],
    '舟山': [122.2559,30.2234],
    '苏州': [120.6519,31.3989],
    '莱芜': [117.6526,36.2714],
    '菏泽': [115.6201,35.2057],
    '营口': [122.4316,40.4297],
    '葫芦岛': [120.1575,40.578],
    '衡水': [115.8838,37.7161],
    '衢州': [118.6853,28.8666],
    '西宁': [101.4038,36.8207],
    '西安': [109.1162,34.2004],
    '贵阳': [106.6992,26.7682],
    '连云港': [119.1248,34.552],
    '邢台': [114.8071,37.2821],
    '邯郸': [114.4775,36.535],
    '郑州': [113.4668,34.6234],
    '鄂尔多斯': [108.9734,39.2487],
    '重庆': [107.7539,30.1904],
    '金华': [120.0037,29.1028],
    '铜川': [109.0393,35.1947],
    '银川': [106.3586,38.1775],
    '镇江': [119.4763,31.9702],
    '长春': [125.8154,44.2584],
    '长沙': [113.0823,28.2568],
    '长治': [112.8625,36.4746],
    '阳泉': [113.4778,38.0951],
    '青岛': [120.4651,36.3373],
    '韶关': [113.7964,24.7028]
};

var BJData = [
    [{name:'北京'}, {name:'上海',value:95}],
    [{name:'北京'}, {name:'广州',value:90}],
    [{name:'北京'}, {name:'大连',value:80}],
    [{name:'北京'}, {name:'南宁',value:70}],
    [{name:'北京'}, {name:'南昌',value:60}],
    [{name:'北京'}, {name:'拉萨',value:50}],
    [{name:'北京'}, {name:'长春',value:40}],
    [{name:'北京'}, {name:'包头',value:30}],
    [{name:'北京'}, {name:'重庆',value:20}],
    [{name:'北京'}, {name:'常州',value:10}]
];

var SHData = [
    [{name:'上海'},{name:'包头',value:95}],
    [{name:'上海'},{name:'昆明',value:90}],
    [{name:'上海'},{name:'广州',value:80}],
    [{name:'上海'},{name:'郑州',value:70}],
    [{name:'上海'},{name:'长春',value:60}],
    [{name:'上海'},{name:'重庆',value:50}],
    [{name:'上海'},{name:'长沙',value:40}],
    [{name:'上海'},{name:'北京',value:30}],
    [{name:'上海'},{name:'丹东',value:20}],
    [{name:'上海'},{name:'大连',value:10}]
];

var GZData = [
    [{name:'广州'},{name:'福州',value:95}],
    [{name:'广州'},{name:'太原',value:90}],
    [{name:'广州'},{name:'长春',value:80}],
    [{name:'广州'},{name:'重庆',value:70}],
    [{name:'广州'},{name:'西安',value:60}],
    [{name:'广州'},{name:'成都',value:50}],
    [{name:'广州'},{name:'常州',value:40}],
    [{name:'广州'},{name:'北京',value:30}],
    [{name:'广州'},{name:'北海',value:20}],
    [{name:'广州'},{name:'海口',value:10}]
];

var planePath = 'path://M1705.06,1318.313v-89.254l-319.9-221.799l0.073-208.063c0.521-84.662-26.629-121.796-63.961-121.491c-37.332-0.305-64.482,36.829-63.961,121.491l0.073,208.063l-319.9,221.799v89.254l330.343-157.288l12.238,241.308l-134.449,92.931l0.531,42.034l175.125-42.917l175.125,42.917l0.531-42.034l-134.449-92.931l12.238-241.308L1705.06,1318.313z';

var convertData = function (data) {
    var res = [];
    for (var i = 0; i < data.length; i++) {
        var dataItem = data[i];
        var fromCoord = geoCoordMap[dataItem[0].name];
        var toCoord = geoCoordMap[dataItem[1].name];
        if (fromCoord && toCoord) {
            res.push([{
                name: dataItem[0].name,
                coord: fromCoord
            }, {
                name: dataItem[1].name,
                coord: toCoord
            }]);
        }
    }
    return res;
};

var color = ['#a6c84c', '#ffa022', '#46bee9'];
var series = [];
[['北京', BJData], ['上海', SHData], ['广州', GZData]].forEach(function (item, i) {
    series.push({
        name: item[0] + ' Top10',
        type: 'lines',
        zlevel: 1,
        effect: {
            show: true,
            period: 6,
            trailLength: 0.7,
            color: '#fff',
            symbolSize: 3
        },
        lineStyle: {
            normal: {
                color: color[i],
                 0,
                curveness: 0.2
            }
        },
        data: convertData(item[1])
    },
    {
        name: item[0] + ' Top10',
        type: 'lines',
        zlevel: 2,
        effect: {
            show: true,
            period: 6,
            trailLength: 0,
            symbol: planePath,
            symbolSize: 15
        },
        lineStyle: {
            normal: {
                color: color[i],
                 1,
                opacity: 0.4,
                curveness: 0.2
            }
        },
        data: convertData(item[1])
    },
    {
        name: item[0] + ' Top10',
        type: 'effectScatter',
        coordinateSystem: 'geo',
        zlevel: 2,
        rippleEffect: {
            brushType: 'stroke'
        },
        label: {
            normal: {
                show: true,
                position: 'right',
                formatter: '{b}'
            }
        },
        symbolSize: function (val) {
            return val[2] / 8;
        },
        itemStyle: {
            normal: {
                color: color[i]
            }
        },
        data: item[1].map(function (dataItem) {
            return {
                name: dataItem[1].name,
                value: geoCoordMap[dataItem[1].name].concat([dataItem[1].value])
            };
        })
    });
});

option = {
    backgroundColor: '#404a59',
    title : {
        text: '模拟迁徙',
        subtext: '数据纯属虚构',
        left: 'center',
        textStyle : {
            color: '#fff'
        }
    },
    tooltip : {
        trigger: 'item'
    },
    legend: {
        orient: 'vertical',
        top: 'bottom',
        left: 'right',
        data:['北京 Top10', '上海 Top10', '广州 Top10'],
        textStyle: {
            color: '#fff'
        },
        selectedMode: 'single'
    },
    geo: {
        map: 'china',
        label: {
            emphasis: {
                show: false
            }
        },
        roam: true,
        itemStyle: {
            normal: {
                areaColor: '#323c48',
                borderColor: '#404a59'
            },
            emphasis: {
                areaColor: '#2a333d'
            }
        }
    },
    series: series
};
// 使用刚指定的配置项和数据显示图表。
myChart.setOption(option);
</script>
</body>
</html>
效果:
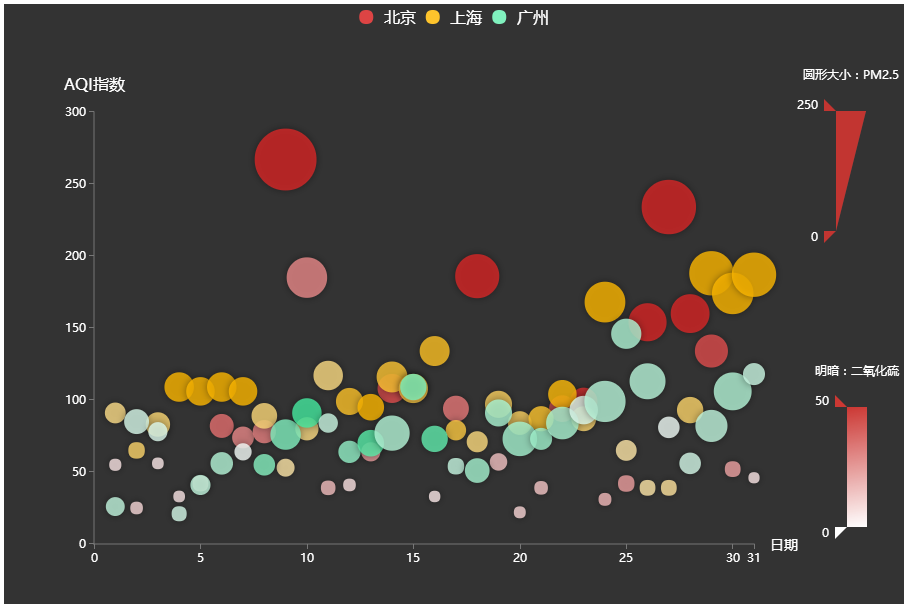
常用图之散点图,K线图和雷达图:
示例:
散点图:
<!DOCTYPE html>
<html>
<head>
    <meta charset="utf-8">
    <title>ECharts</title>
    <!-- 引入 echarts.js -->
    <script src="../echarts.min.js"></script>
</head>
<body>
    <!-- 为ECharts准备一个具备大小(宽高)的Dom -->
<div id="main" style=" 900px;height:600px;"></div>
<script type="text/javascript">
        // 基于准备好的dom,初始化echarts实例
var myChart = echarts.init(document.getElementById('main'));

// 指定图表的配置项和数据
var dataBJ = [
    [1,55,9,56,0.46,18,6,"良"],
    [2,25,11,21,0.65,34,9,"优"],
    [3,56,7,63,0.3,14,5,"良"],
    [4,33,7,29,0.33,16,6,"优"],
    [5,42,24,44,0.76,40,16,"优"],
    [6,82,58,90,1.77,68,33,"良"],
    [7,74,49,77,1.46,48,27,"良"],
    [8,78,55,80,1.29,59,29,"良"],
    [9,267,216,280,4.8,108,64,"重度污染"],
    [10,185,127,216,2.52,61,27,"中度污染"],
    [11,39,19,38,0.57,31,15,"优"],
    [12,41,11,40,0.43,21,7,"优"],
    [13,64,38,74,1.04,46,22,"良"],
    [14,108,79,120,1.7,75,41,"轻度污染"],
    [15,108,63,116,1.48,44,26,"轻度污染"],
    [16,33,6,29,0.34,13,5,"优"],
    [17,94,66,110,1.54,62,31,"良"],
    [18,186,142,192,3.88,93,79,"中度污染"],
    [19,57,31,54,0.96,32,14,"良"],
    [20,22,8,17,0.48,23,10,"优"],
    [21,39,15,36,0.61,29,13,"优"],
    [22,94,69,114,2.08,73,39,"良"],
    [23,99,73,110,2.43,76,48,"良"],
    [24,31,12,30,0.5,32,16,"优"],
    [25,42,27,43,1,53,22,"优"],
    [26,154,117,157,3.05,92,58,"中度污染"],
    [27,234,185,230,4.09,123,69,"重度污染"],
    [28,160,120,186,2.77,91,50,"中度污染"],
    [29,134,96,165,2.76,83,41,"轻度污染"],
    [30,52,24,60,1.03,50,21,"良"],
    [31,46,5,49,0.28,10,6,"优"]
];

var dataGZ = [
    [1,26,37,27,1.163,27,13,"优"],
    [2,85,62,71,1.195,60,8,"良"],
    [3,78,38,74,1.363,37,7,"良"],
    [4,21,21,36,0.634,40,9,"优"],
    [5,41,42,46,0.915,81,13,"优"],
    [6,56,52,69,1.067,92,16,"良"],
    [7,64,30,28,0.924,51,2,"良"],
    [8,55,48,74,1.236,75,26,"良"],
    [9,76,85,113,1.237,114,27,"良"],
    [10,91,81,104,1.041,56,40,"良"],
    [11,84,39,60,0.964,25,11,"良"],
    [12,64,51,101,0.862,58,23,"良"],
    [13,70,69,120,1.198,65,36,"良"],
    [14,77,105,178,2.549,64,16,"良"],
    [15,109,68,87,0.996,74,29,"轻度污染"],
    [16,73,68,97,0.905,51,34,"良"],
    [17,54,27,47,0.592,53,12,"良"],
    [18,51,61,97,0.811,65,19,"良"],
    [19,91,71,121,1.374,43,18,"良"],
    [20,73,102,182,2.787,44,19,"良"],
    [21,73,50,76,0.717,31,20,"良"],
    [22,84,94,140,2.238,68,18,"良"],
    [23,93,77,104,1.165,53,7,"良"],
    [24,99,130,227,3.97,55,15,"良"],
    [25,146,84,139,1.094,40,17,"轻度污染"],
    [26,113,108,137,1.481,48,15,"轻度污染"],
    [27,81,48,62,1.619,26,3,"良"],
    [28,56,48,68,1.336,37,9,"良"],
    [29,82,92,174,3.29,0,13,"良"],
    [30,106,116,188,3.628,101,16,"轻度污染"],
    [31,118,50,0,1.383,76,11,"轻度污染"]
];

var dataSH = [
    [1,91,45,125,0.82,34,23,"良"],
    [2,65,27,78,0.86,45,29,"良"],
    [3,83,60,84,1.09,73,27,"良"],
    [4,109,81,121,1.28,68,51,"轻度污染"],
    [5,106,77,114,1.07,55,51,"轻度污染"],
    [6,109,81,121,1.28,68,51,"轻度污染"],
    [7,106,77,114,1.07,55,51,"轻度污染"],
    [8,89,65,78,0.86,51,26,"良"],
    [9,53,33,47,0.64,50,17,"良"],
    [10,80,55,80,1.01,75,24,"良"],
    [11,117,81,124,1.03,45,24,"轻度污染"],
    [12,99,71,142,1.1,62,42,"良"],
    [13,95,69,130,1.28,74,50,"良"],
    [14,116,87,131,1.47,84,40,"轻度污染"],
    [15,108,80,121,1.3,85,37,"轻度污染"],
    [16,134,83,167,1.16,57,43,"轻度污染"],
    [17,79,43,107,1.05,59,37,"良"],
    [18,71,46,89,0.86,64,25,"良"],
    [19,97,71,113,1.17,88,31,"良"],
    [20,84,57,91,0.85,55,31,"良"],
    [21,87,63,101,0.9,56,41,"良"],
    [22,104,77,119,1.09,73,48,"轻度污染"],
    [23,87,62,100,1,72,28,"良"],
    [24,168,128,172,1.49,97,56,"中度污染"],
    [25,65,45,51,0.74,39,17,"良"],
    [26,39,24,38,0.61,47,17,"优"],
    [27,39,24,39,0.59,50,19,"优"],
    [28,93,68,96,1.05,79,29,"良"],
    [29,188,143,197,1.66,99,51,"中度污染"],
    [30,174,131,174,1.55,108,50,"中度污染"],
    [31,187,143,201,1.39,89,53,"中度污染"]
];

var schema = [
    {name: 'date', index: 0, text: '日'},
    {name: 'AQIindex', index: 1, text: 'AQI指数'},
    {name: 'PM25', index: 2, text: 'PM2.5'},
    {name: 'PM10', index: 3, text: 'PM10'},
    {name: 'CO', index: 4, text: '一氧化碳(CO)'},
    {name: 'NO2', index: 5, text: '二氧化氮(NO2)'},
    {name: 'SO2', index: 6, text: '二氧化硫(SO2)'}
];


var itemStyle = {
    normal: {
        opacity: 0.8,
        shadowBlur: 10,
        shadowOffsetX: 0,
        shadowOffsetY: 0,
        shadowColor: 'rgba(0, 0, 0, 0.5)'
    }
};

option = {
    backgroundColor: '#333',
    color: [
        '#dd4444', '#fec42c', '#80F1BE'
    ],
    legend: {
        y: 'top',
        data: ['北京', '上海', '广州'],
        textStyle: {
            color: '#fff',
            fontSize: 16
        }
    },
    grid: {
        x: '10%',
        x2: 150,
        y: '18%',
        y2: '10%'
    },
    tooltip: {
        padding: 10,
        backgroundColor: '#222',
        borderColor: '#777',
        borderWidth: 1,
        formatter: function (obj) {
            var value = obj.value;
            return '<div style="border-bottom: 1px solid rgba(255,255,255,.3); font-size: 18px;padding-bottom: 7px;margin-bottom: 7px">'
                + obj.seriesName + ' ' + value[0] + '日:'
                + value[7]
                + '</div>'
                + schema[1].text + ':' + value[1] + '<br>'
                + schema[2].text + ':' + value[2] + '<br>'
                + schema[3].text + ':' + value[3] + '<br>'
                + schema[4].text + ':' + value[4] + '<br>'
                + schema[5].text + ':' + value[5] + '<br>'
                + schema[6].text + ':' + value[6] + '<br>';
        }
    },
    xAxis: {
        type: 'value',
        name: '日期',
        nameGap: 16,
        nameTextStyle: {
            color: '#fff',
            fontSize: 14
        },
        max: 31,
        splitLine: {
            show: false
        },
        axisLine: {
            lineStyle: {
                color: '#777'
            }
        },
        axisTick: {
            lineStyle: {
                color: '#777'
            }
        },
        axisLabel: {
            formatter: '{value}',
            textStyle: {
                color: '#fff'
            }
        }
    },
    yAxis: {
        type: 'value',
        name: 'AQI指数',
        nameLocation: 'end',
        nameGap: 20,
        nameTextStyle: {
            color: '#fff',
            fontSize: 16
        },
        axisLine: {
            lineStyle: {
                color: '#777'
            }
        },
        axisTick: {
            lineStyle: {
                color: '#777'
            }
        },
        splitLine: {
            show: false
        },
        axisLabel: {
            textStyle: {
                color: '#fff'
            }
        }
    },
    visualMap: [
        {
            left: 'right',
            top: '10%',
            dimension: 2,
            min: 0,
            max: 250,
            itemWidth: 30,
            itemHeight: 120,
            calculable: true,
            precision: 0.1,
            text: ['圆形大小:PM2.5'],
            textGap: 30,
            textStyle: {
                color: '#fff'
            },
            inRange: {
                symbolSize: [10, 70]
            },
            outOfRange: {
                symbolSize: [10, 70],
                color: ['rgba(255,255,255,.2)']
            },
            controller: {
                inRange: {
                    color: ['#c23531']
                },
                outOfRange: {
                    color: ['#444']
                }
            }
        },
        {
            left: 'right',
            bottom: '5%',
            dimension: 6,
            min: 0,
            max: 50,
            itemHeight: 120,
            calculable: true,
            precision: 0.1,
            text: ['明暗:二氧化硫'],
            textGap: 30,
            textStyle: {
                color: '#fff'
            },
            inRange: {
                colorLightness: [1, 0.5]
            },
            outOfRange: {
                color: ['rgba(255,255,255,.2)']
            },
            controller: {
                inRange: {
                    color: ['#c23531']
                },
                outOfRange: {
                    color: ['#444']
                }
            }
        }
    ],
    series: [
        {
            name: '北京',
            type: 'scatter',
            itemStyle: itemStyle,
            data: dataBJ
        },
        {
            name: '上海',
            type: 'scatter',
            itemStyle: itemStyle,
            data: dataSH
        },
        {
            name: '广州',
            type: 'scatter',
            itemStyle: itemStyle,
            data: dataGZ
        }
    ]
};

// 使用刚指定的配置项和数据显示图表。
myChart.setOption(option);
</script>
</body>
</html>
效果:
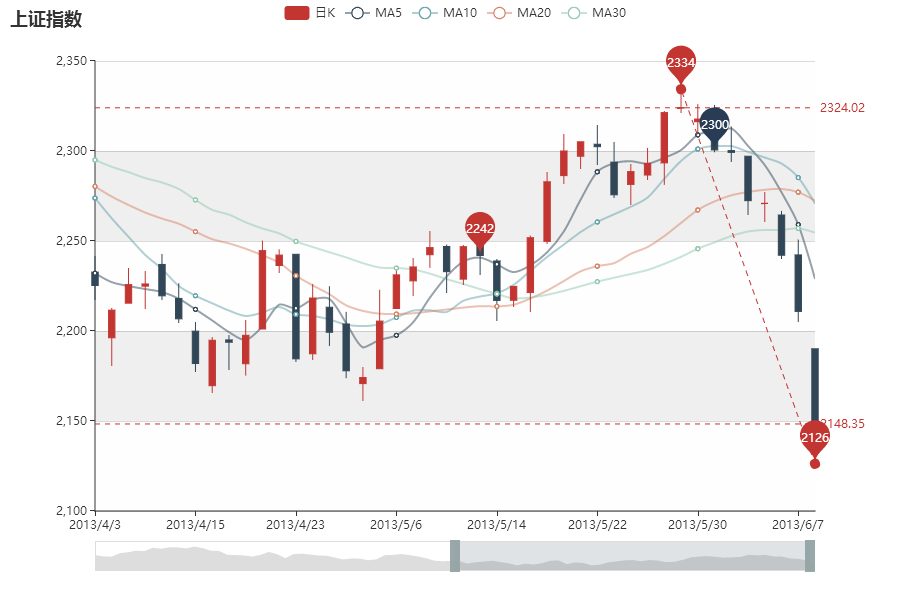
K线图:
<!DOCTYPE html>
<html>
<head>
    <meta charset="utf-8">
    <title>ECharts</title>
    <!-- 引入 echarts.js -->
    <script src="../echarts.min.js"></script>
</head>
<body>
    <!-- 为ECharts准备一个具备大小(宽高)的Dom -->
<div id="main" style=" 900px;height:600px;"></div>
<script type="text/javascript">
        // 基于准备好的dom,初始化echarts实例
var myChart = echarts.init(document.getElementById('main'));

// 指定图表的配置项和数据
// 数据意义:开盘(open),收盘(close),最低(lowest),最高(highest)
var data0 = splitData([
    ['2013/1/24', 2320.26,2320.26,2287.3,2362.94],
    ['2013/1/25', 2300,2291.3,2288.26,2308.38],
    ['2013/1/28', 2295.35,2346.5,2295.35,2346.92],
    ['2013/1/29', 2347.22,2358.98,2337.35,2363.8],
    ['2013/1/30', 2360.75,2382.48,2347.89,2383.76],
    ['2013/1/31', 2383.43,2385.42,2371.23,2391.82],
    ['2013/2/1', 2377.41,2419.02,2369.57,2421.15],
    ['2013/2/4', 2425.92,2428.15,2417.58,2440.38],
    ['2013/2/5', 2411,2433.13,2403.3,2437.42],
    ['2013/2/6', 2432.68,2434.48,2427.7,2441.73],
    ['2013/2/7', 2430.69,2418.53,2394.22,2433.89],
    ['2013/2/8', 2416.62,2432.4,2414.4,2443.03],
    ['2013/2/18', 2441.91,2421.56,2415.43,2444.8],
    ['2013/2/19', 2420.26,2382.91,2373.53,2427.07],
    ['2013/2/20', 2383.49,2397.18,2370.61,2397.94],
    ['2013/2/21', 2378.82,2325.95,2309.17,2378.82],
    ['2013/2/22', 2322.94,2314.16,2308.76,2330.88],
    ['2013/2/25', 2320.62,2325.82,2315.01,2338.78],
    ['2013/2/26', 2313.74,2293.34,2289.89,2340.71],
    ['2013/2/27', 2297.77,2313.22,2292.03,2324.63],
    ['2013/2/28', 2322.32,2365.59,2308.92,2366.16],
    ['2013/3/1', 2364.54,2359.51,2330.86,2369.65],
    ['2013/3/4', 2332.08,2273.4,2259.25,2333.54],
    ['2013/3/5', 2274.81,2326.31,2270.1,2328.14],
    ['2013/3/6', 2333.61,2347.18,2321.6,2351.44],
    ['2013/3/7', 2340.44,2324.29,2304.27,2352.02],
    ['2013/3/8', 2326.42,2318.61,2314.59,2333.67],
    ['2013/3/11', 2314.68,2310.59,2296.58,2320.96],
    ['2013/3/12', 2309.16,2286.6,2264.83,2333.29],
    ['2013/3/13', 2282.17,2263.97,2253.25,2286.33],
    ['2013/3/14', 2255.77,2270.28,2253.31,2276.22],
    ['2013/3/15', 2269.31,2278.4,2250,2312.08],
    ['2013/3/18', 2267.29,2240.02,2239.21,2276.05],
    ['2013/3/19', 2244.26,2257.43,2232.02,2261.31],
    ['2013/3/20', 2257.74,2317.37,2257.42,2317.86],
    ['2013/3/21', 2318.21,2324.24,2311.6,2330.81],
    ['2013/3/22', 2321.4,2328.28,2314.97,2332],
    ['2013/3/25', 2334.74,2326.72,2319.91,2344.89],
    ['2013/3/26', 2318.58,2297.67,2281.12,2319.99],
    ['2013/3/27', 2299.38,2301.26,2289,2323.48],
    ['2013/3/28', 2273.55,2236.3,2232.91,2273.55],
    ['2013/3/29', 2238.49,2236.62,2228.81,2246.87],
    ['2013/4/1', 2229.46,2234.4,2227.31,2243.95],
    ['2013/4/2', 2234.9,2227.74,2220.44,2253.42],
    ['2013/4/3', 2232.69,2225.29,2217.25,2241.34],
    ['2013/4/8', 2196.24,2211.59,2180.67,2212.59],
    ['2013/4/9', 2215.47,2225.77,2215.47,2234.73],
    ['2013/4/10', 2224.93,2226.13,2212.56,2233.04],
    ['2013/4/11', 2236.98,2219.55,2217.26,2242.48],
    ['2013/4/12', 2218.09,2206.78,2204.44,2226.26],
    ['2013/4/15', 2199.91,2181.94,2177.39,2204.99],
    ['2013/4/16', 2169.63,2194.85,2165.78,2196.43],
    ['2013/4/17', 2195.03,2193.8,2178.47,2197.51],
    ['2013/4/18', 2181.82,2197.6,2175.44,2206.03],
    ['2013/4/19', 2201.12,2244.64,2200.58,2250.11],
    ['2013/4/22', 2236.4,2242.17,2232.26,2245.12],
    ['2013/4/23', 2242.62,2184.54,2182.81,2242.62],
    ['2013/4/24', 2187.35,2218.32,2184.11,2226.12],
    ['2013/4/25', 2213.19,2199.31,2191.85,2224.63],
    ['2013/4/26', 2203.89,2177.91,2173.86,2210.58],
    ['2013/5/2', 2170.78,2174.12,2161.14,2179.65],
    ['2013/5/3', 2179.05,2205.5,2179.05,2222.81],
    ['2013/5/6', 2212.5,2231.17,2212.5,2236.07],
    ['2013/5/7', 2227.86,2235.57,2219.44,2240.26],
    ['2013/5/8', 2242.39,2246.3,2235.42,2255.21],
    ['2013/5/9', 2246.96,2232.97,2221.38,2247.86],
    ['2013/5/10', 2228.82,2246.83,2225.81,2247.67],
    ['2013/5/13', 2247.68,2241.92,2231.36,2250.85],
    ['2013/5/14', 2238.9,2217.01,2205.87,2239.93],
    ['2013/5/15', 2217.09,2224.8,2213.58,2225.19],
    ['2013/5/16', 2221.34,2251.81,2210.77,2252.87],
    ['2013/5/17', 2249.81,2282.87,2248.41,2288.09],
    ['2013/5/20', 2286.33,2299.99,2281.9,2309.39],
    ['2013/5/21', 2297.11,2305.11,2290.12,2305.3],
    ['2013/5/22', 2303.75,2302.4,2292.43,2314.18],
    ['2013/5/23', 2293.81,2275.67,2274.1,2304.95],
    ['2013/5/24', 2281.45,2288.53,2270.25,2292.59],
    ['2013/5/27', 2286.66,2293.08,2283.94,2301.7],
    ['2013/5/28', 2293.4,2321.32,2281.47,2322.1],
    ['2013/5/29', 2323.54,2324.02,2321.17,2334.33],
    ['2013/5/30', 2316.25,2317.75,2310.49,2325.72],
    ['2013/5/31', 2320.74,2300.59,2299.37,2325.53],
    ['2013/6/3', 2300.21,2299.25,2294.11,2313.43],
    ['2013/6/4', 2297.1,2272.42,2264.76,2297.1],
    ['2013/6/5', 2270.71,2270.93,2260.87,2276.86],
    ['2013/6/6', 2264.43,2242.11,2240.07,2266.69],
    ['2013/6/7', 2242.26,2210.9,2205.07,2250.63],
    ['2013/6/13', 2190.1,2148.35,2126.22,2190.1]
]);


function splitData(rawData) {
    var categoryData = [];
    var values = []
    for (var i = 0; i < rawData.length; i++) {
        categoryData.push(rawData[i].splice(0, 1)[0]);
        values.push(rawData[i])
    }
    return {
        categoryData: categoryData,
        values: values
    };
}

function calculateMA(dayCount) {
    var result = [];
    for (var i = 0, len = data0.values.length; i < len; i++) {
        if (i < dayCount) {
            result.push('-');
            continue;
        }
        var sum = 0;
        for (var j = 0; j < dayCount; j++) {
            sum += data0.values[i - j][1];
        }
        result.push(sum / dayCount);
    }
    return result;
}


option = {
    title: {
        text: '上证指数',
        left: 0
    },
    tooltip: {
        trigger: 'axis',
        axisPointer: {
            type: 'line'
        }
    },
    legend: {
        data: ['日K', 'MA5', 'MA10', 'MA20', 'MA30']
    },
    grid: {
        left: '10%',
        right: '10%',
        bottom: '15%'
    },
    xAxis: {
        type: 'category',
        data: data0.categoryData,
        scale: true,
        boundaryGap : false,
        axisLine: {onZero: false},
        splitLine: {show: false},
        splitNumber: 20,
        min: 'dataMin',
        max: 'dataMax'
    },
    yAxis: {
        scale: true,
        splitArea: {
            show: true
        }
    },
    dataZoom: [
        {
            type: 'inside',
            start: 50,
            end: 100
        },
        {
            show: true,
            type: 'slider',
            y: '90%',
            start: 50,
            end: 100
        }
    ],
    series: [
        {
            name: '日K',
            type: 'candlestick',
            data: data0.values,
            markPoint: {
                label: {
                    normal: {
                        formatter: function (param) {
                            return param != null ? Math.round(param.value) : '';
                        }
                    }
                },
                data: [
                    {
                        name: 'XX标点',
                        coord: ['2013/5/31', 2300],
                        value: 2300,
                        itemStyle: {
                            normal: {color: 'rgb(41,60,85)'}
                        }
                    },
                    {
                        name: 'highest value',
                        type: 'max',
                        valueDim: 'highest'
                    },
                    {
                        name: 'lowest value',
                        type: 'min',
                        valueDim: 'lowest'
                    },
                    {
                        name: 'average value on close',
                        type: 'average',
                        valueDim: 'close'
                    }
                ],
                tooltip: {
                    formatter: function (param) {
                        return param.name + '<br>' + (param.data.coord || '');
                    }
                }
            },
            markLine: {
                symbol: ['none', 'none'],
                data: [
                    [
                        {
                            name: 'from lowest to highest',
                            type: 'min',
                            valueDim: 'lowest',
                            symbol: 'circle',
                            symbolSize: 10,
                            label: {
                                normal: {show: false},
                                emphasis: {show: false}
                            }
                        },
                        {
                            type: 'max',
                            valueDim: 'highest',
                            symbol: 'circle',
                            symbolSize: 10,
                            label: {
                                normal: {show: false},
                                emphasis: {show: false}
                            }
                        }
                    ],
                    {
                        name: 'min line on close',
                        type: 'min',
                        valueDim: 'close'
                    },
                    {
                        name: 'max line on close',
                        type: 'max',
                        valueDim: 'close'
                    }
                ]
            }
        },
        {
            name: 'MA5',
            type: 'line',
            data: calculateMA(5),
            smooth: true,
            lineStyle: {
                normal: {opacity: 0.5}
            }
        },
        {
            name: 'MA10',
            type: 'line',
            data: calculateMA(10),
            smooth: true,
            lineStyle: {
                normal: {opacity: 0.5}
            }
        },
        {
            name: 'MA20',
            type: 'line',
            data: calculateMA(20),
            smooth: true,
            lineStyle: {
                normal: {opacity: 0.5}
            }
        },
        {
            name: 'MA30',
            type: 'line',
            data: calculateMA(30),
            smooth: true,
            lineStyle: {
                normal: {opacity: 0.5}
            }
        },

    ]
};


// 使用刚指定的配置项和数据显示图表。
myChart.setOption(option);
</script>
</body>
</html>
效果:
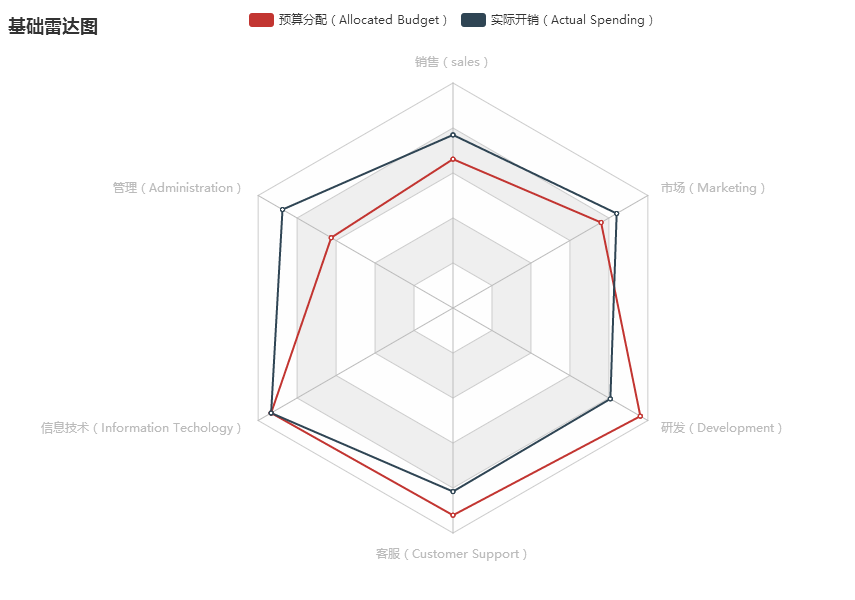
雷达图:
<!DOCTYPE html>
<html>
<head>
    <meta charset="utf-8">
    <title>ECharts</title>
    <!-- 引入 echarts.js -->
    <script src="../echarts.min.js"></script>
</head>
<body>
    <!-- 为ECharts准备一个具备大小(宽高)的Dom -->
<div id="main" style=" 900px;height:600px;"></div>
<script type="text/javascript">
        // 基于准备好的dom,初始化echarts实例
var myChart = echarts.init(document.getElementById('main'));

// 指定图表的配置项和数据
option = {
    title: {
        text: '基础雷达图'
    },
    tooltip: {},
    legend: {
        data: ['预算分配(Allocated Budget)', '实际开销(Actual Spending)']
    },
    radar: {
        // shape: 'circle',
        indicator: [
           { name: '销售(sales)', max: 6500},
           { name: '管理(Administration)', max: 16000},
           { name: '信息技术(Information Techology)', max: 30000},
           { name: '客服(Customer Support)', max: 38000},
           { name: '研发(Development)', max: 52000},
           { name: '市场(Marketing)', max: 25000}
        ]
    },
    series: [{
        name: '预算 vs 开销(Budget vs spending)',
        type: 'radar',
        // areaStyle: {normal: {}},
        data : [
            {
                value : [4300, 10000, 28000, 35000, 50000, 19000],
                name : '预算分配(Allocated Budget)'
            },
             {
                value : [5000, 14000, 28000, 31000, 42000, 21000],
                name : '实际开销(Actual Spending)'
            }
        ]
    }]
};
// 使用刚指定的配置项和数据显示图表。
myChart.setOption(option);
</script>
</body>
</html>
效果:
如果有不理解的,请看其官网中的API:http://echarts.baidu.com/api.html#echarts,相信每个人都能从中有所收获!!!