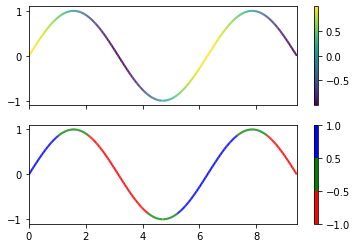
绘制多彩的曲线
效果图
代码
import numpy as np
import matplotlib.pyplot as plt
from matplotlib.collections import LineCollection
from matplotlib.colors import ListedColormap, BoundaryNorm

x = np.linspace(0, 3*np.pi, 500)
y = np.sin(x)
dydx= np.cos(0.5*(x[:-1]+x[1:])) # 两点之间的中点的导数

"""
这里的目的是在两个点之间创建一个“小段”,每个段需要两个点.
np.concatenate() 用于将两个数组在指定的轴上进行合并(串联起来)
"""
points = np.array([x,y]).T.reshape(-1,1,2)
segments = np.concatenate([points[:-1], points[1:]], axis=1)

fig, axs = plt.subplots(2,1,sharex=True,sharey=True)

"""
创建一个从数据点到颜色的(连续)映射
"""
norm = plt.Normalize(dydx.min(), dydx.max())
lc = LineCollection(segments, norm=norm, cmap='viridis')

lc.set_array(dydx) # 设置每个相当的值,对应一种颜色
lc.set_linewidth(2) # 设置线宽

line= axs[0].add_collection(lc)
fig.colorbar(line, ax=axs[0])

axs[0].set_xlim(x.min(), x.max())
axs[0].set_ylim(-1.1, 1.1)

"""
创建一个(边界)的映射关系
"""
cmap = ListedColormap(['r', 'g', 'b'])
# cmap有三种颜色,对应三段,因此需要4个点
norm = BoundaryNorm([-1, -0.5, 0.5, 1], cmap.N)
lc = LineCollection(segments, cmap=cmap, norm=norm)
lc.set_array(dydx)
lc.set_linewidth(2)
line = axs[1].add_collection(lc)
fig.colorbar(line, ax=axs[1])

plt.show()
代码中使用到的类简单介绍一下,具体参数或用法可以点击查看。
-
LineCollection 大概是一个“线段集合”的类
matplotlib.collections.LineCollection(segments, *args, zorder=2, **kwargs)
"""
segments : list of array-like
            A sequence of (*line0*, *line1*, *line2*), where::

                linen = (x0, y0), (x1, y1), ... (xm, ym)

            or the equivalent numpy array with two columns. Each line
            can have a different number of segments.
"""
其中可选的参数为
argnames = ["linewidths", "colors", "antialiaseds", "linestyles", "offsets", "transOffset", "norm", "cmap", "pickradius", "zorder", "facecolors"] -
ListedColormap Colormap object generated from a list of colors.
matplotlib.colors.ListedColormap(colors, name='from_list', N=None) """ colors : list, array List of Matplotlib color specifications, or an equivalent Nx3 or Nx4 floating point array (*N* rgb or rgba values). name : str, optional String to identify the colormap. N : int, optional Number of entries in the map. The default is *None*, """ -
BoundaryNorm 将每个区间进行映射
matplotlib.colors.BoundaryNorm(boundaries, ncolors, clip=False, *, extend='neither')
"""
boundaries : array-like,
            Monotonically increasing sequence of at least 2 boundaries.
ncolors : int,
         Number of colors in the colormap to be used.
"""
例如,
norm = BoundaryNorm([-1, -0.5, 0.5, 1], 3),将([-1,-0.5]),((-0.5,0.5)),([0.5, 1])分别映射一种颜色。