学习中遇到的其他问题:
1. 填写以下内容,使得统计在2015年整年内(即1月1日至12月31日)微软股票涨价的每个月天数据。


list1 = []
tmpdf = quotesdf['15/01/01':'15/12/31']
for i in range(0, len(tmpdf)):
    list1.append(int(tmpdf.index[i][3:5]))
tmpdf['____'] = list1
print tmpdf[ tmpdf.close > temp._____]['month'].value_counts()
2. 以下哪一个选项能合并在2015年整年内(即1月1日至12月31日)微软股票收盘价最高的5天和最低的5天?
sorted = quotesdf.sort('close')
pd.concat([sorted[:5],sorted[__:]])
3. 求微软公司2015年每个月股票收盘价的平均值。
In [1]: from matplotlib.finance import quotes_historical_yahoo_ochl

In [2]: from datetime import date,datetime

In [3]: import pandas as pd

In [4]: start = date(2015,1,1)  # 创建时间格式

In [5]: end = date(2016,1,1)

In [6]: quotes = quotes_historical_yahoo_ochl('MSFT',start,end)

In [7]: fields = ('date','open','close','high','low','volume')

In [8]: list1 = []

In [9]: for i in range(0,len(quotes)):
   ...:     x = date.fromordinal(int(quotes[i][0]))
   ...:     y = datetime.strftime(x,'%m')  # 仅表示为月份即可
   ...:     list1.append(y)
   ...:

In [10]: quotesdf = pd.DataFrame(quotes,index=list1,columns=fields)

In [11]: quotesdf
Out[11]:
        date       open      close       high        low       volume
01  735600.0  44.210266  44.305014  44.930363  44.096567   27913900.0
01  735603.0  43.935490  43.897593  44.276590  43.821791   39673900.0
...
12  735963.0  54.543321  53.998276  54.689313  53.939876   26529600.0

[252 rows x 6 columns]

In [17]: quotesdf['month'] = list1  # 添加一列月份用于分组

In [18]: quotesdf
Out[18]:
        date       open      close       high        low       volume month
01  735600.0  44.210266  44.305014  44.930363  44.096567   27913900.0    01
01  735603.0  43.935490  43.897593  44.276590  43.821791   39673900.0    01
...
12  735963.0  54.543321  53.998276  54.689313  53.939876   26529600.0    12

[252 rows x 7 columns]

In [20]: quotesdf.groupby('month').close.mean()  # 分组,选列,计算
Out[20]:
month
01    43.124433
02    40.956772
03    40.203918
04    41.477685
05    45.472291
06    44.145879
07    43.807541
08    43.838895
09    42.114155
10    47.082882
11    52.252878
12    53.916431
Name: close, dtype: float64
1. 在 ipython 下运行已经存储好的python代码:In [5]: run finance_data.py
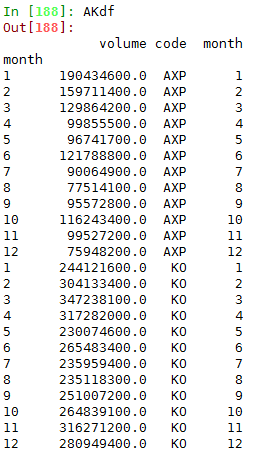
1. 需要生成下图中的DataFrame