前端由vue+element搭建框架,引入vue和element的index.js和css就可以写页面;
页面和js可以echarts官网实例看下都是有的,主要看下如何动态赋值:
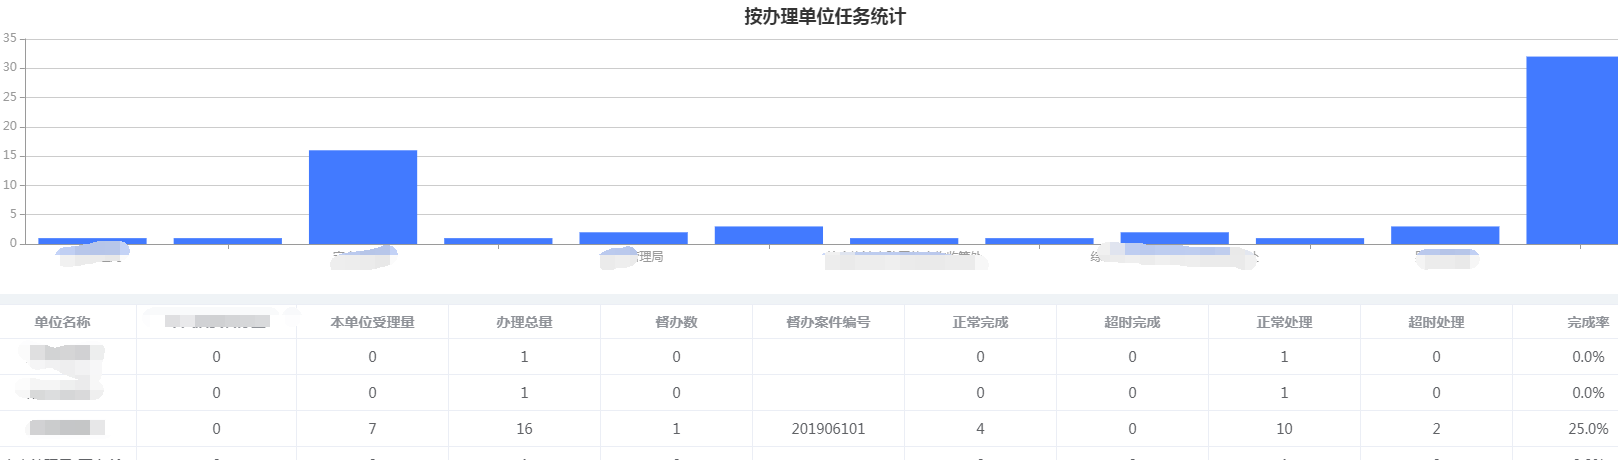
柱状图和列表:
<script type="text/javascript" src="/main/common/echarts/echarts.min.js"></script>

<div id="echart" style=" 100%;height: 300px;margin-bottom: 10px"></div>
<el-table :data="tableData" border style="margin: 0 auto" row-class-name="row_padding"
                      header-row-class-name="head_padding">
                <el-table-column fixed prop="processDeptName" label="单位名称" align="center" width="150" show-overflow-tooltip></el-table-column>
                <el-table-column prop="acceptCount" label="本单位受理量"  align="center" show-overflow-tooltip></el-table-column>
                <el-table-column prop="totalCount" label="办理总量"  align="center" show-overflow-tooltip></el-table-column>
                <el-table-column prop="completedCount" label="正常完成"  align="center" show-overflow-tooltip></el-table-column>
                <el-table-column prop="completedOverCount" label="超时完成"  align="center" show-overflow-tooltip></el-table-column>
                <el-table-column prop="processCount" label="正常处理"  align="center" show-overflow-tooltip></el-table-column>
                <el-table-column prop="processOverCount" label="超时处理"  align="center" show-overflow-tooltip></el-table-column>
                <el-table-column prop="completedPercent" label="完成率"  align="center" show-overflow-tooltip></el-table-column>
            </el-table>
js:
var vue = new Vue({
    el: '#app',
    data: {
        tableData:[],
    },
    created: function () {
        this.initTable();
    },

getChartOption(data){
            var option = {
                title: {
                    text: '按办理单位任务统计',
                    x:'center',
                    textAlign:'left',
                    top:'3%'
                },
                tooltip: {
                    trigger: 'axis',
                    axisPointer: {
                        type: 'shadow'
                    }
                },
                grid: {
                    left: '1%',
                    right: '1%',
                    top: '15%',
                    bottom:'10%',
                    containLabel: true
                },
                backgroundColor:'#fff',
                xAxis: {
                    type: 'category',
                    data: data.nameList,
                    axisLine:{
                        lineStyle:{
                            color:'#9a9a9a'
                        }
                    }
                },
                yAxis: {
                    type: 'value',
                    axisLine:{
                        lineStyle:{
                            color:'#9a9a9a'
                        }
                    }
                },
                series: [{
                    data: data.valueList,
                    type: 'bar',
                    itemStyle:{
                        normal:{
                            color:'#427aff'
                        }
                    }
                }]
            };
            return option;
        },
var ele=document.getElementById('echart');
                            var myChart = echarts.init(ele);
                            var option=self.getChartOption({
                                nameList:nameList,
                                valueList:valueList
                            });
                            myChart.setOption(option);
                            window.onresize = myChart.resize;
效果: