=================================版权声明=================================
版权声明:原创文章 禁止转载
请通过右侧公告中的“联系邮箱(wlsandwho@foxmail.com)”联系我
勿用于学术性引用。
勿用于商业出版、商业印刷、商业引用以及其他商业用途。
本文不定期修正完善。
本文链接:http://www.cnblogs.com/wlsandwho/p/7587203.html
耻辱墙:http://www.cnblogs.com/wlsandwho/p/4206472.html
=======================================================================
这个示例实际上是对kNN的练习,区别是使用来自文件的数据。
=======================================================================
1从文件中读取数据并格式化为指定方式。
文件为file2matrix.py
 1 from numpy import *
 2 '''
 3 def file2matrix1(filename):
 4     f=open(filename)
 5     arrlines=f.readlines()
 6     rows=len(arrlines)
 7     retmat=zeros((rows,3))
 8     vctlabels=[]
 9     index=0
10
11     for line in arrlines:
12         line=line.strip()
13         list=line.split("	")
14         retmat[index,0:3]=list[0:3]
15         vctlabels.append(int(list[-1]))
16         index+=1
17
18     return retmat,vctlabels
19
20 mat1,labels1=file2matrix1("datingTestSet2.txt")
21 print(mat1)
22 print(labels1)
23 '''
24 def file2matrix(filename):
25     with open(filename) as file:
26         line1=file.readline()
27         list1=line1.split()
28         cols=len(list1)
29         file.seek(0,0)
30         lines=file.readlines()
31         rows=len(lines)
32
33         index=0
34         labels=[]
35         realcol=cols-1
36         retmat=zeros((rows,realcol))
37         for line in lines:
38             list=line.split()
39             retmat[index,:]=list[0:realcol]
40             labels.append(int(list[-1]))
41
42             index+=1
43     return retmat,labels
44
45 def file2matrix2(filename):
46     with open(filename) as file:
47         line1=file.readline()
48         list1=line1.split()
49         cols=len(list1)
50         file.seek(0,0)
51         lines=file.readlines()
52         rows=len(lines)
53
54         index=0
55         labels=[]
56         realcol=cols-1
57         retmat=zeros((rows,realcol))
58         for line in lines:
59             list=line.split()
60             retmat[index,:]=list[0:realcol]
61             #labels.append(int(list[-1]))
62             if("largeDoses"==list[-1]):
63                 labels.append(3)
64             elif("smallDoses"==list[-1]):
65                 labels.append(2)
66             elif("didntLike"==list[-1]):
67                 labels.append(1)
68             index+=1
69     return retmat,labels
测试一下
文件为test_file2matrix.py
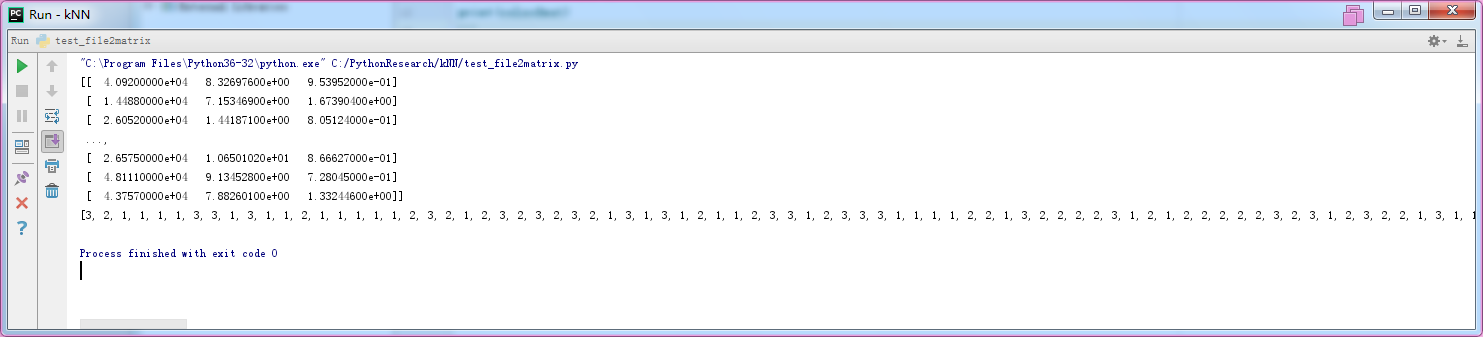
1 from file2matrix import *
2
3
4 mat,labels=file2matrix("datingTestSet2.txt")
5 print(mat)
6 print(labels)
结果(红框是因为我用的虚拟机,不要在意这些细节)
=======================================================================
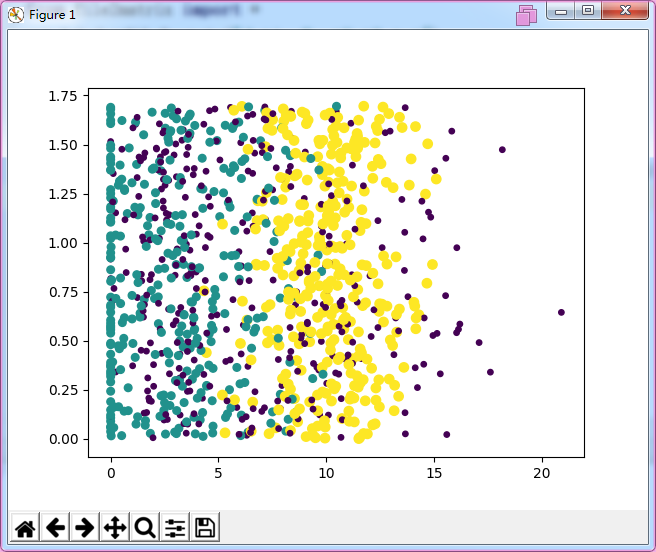
2 做个图看看相关性/趋势。实际上这里并没有做数学上的讨论,就是画个图看看臆测一下。
文件是drawapicture1.py
 1 import matplotlib
 2 import matplotlib.pyplot as plt
 3 import numpy
 4 from file2matrix import *
 5 mat,labels=file2matrix("datingTestSet2.txt")
 6 nSizeofLabels=len(labels)
 7
 8 fig=plt.figure()
 9 ax=fig.add_subplot(111)
10 ax.scatter(mat[:,1],mat[:,2],s=15.0*array(labels),c=15.0*array(labels))
11 plt.show()
结果
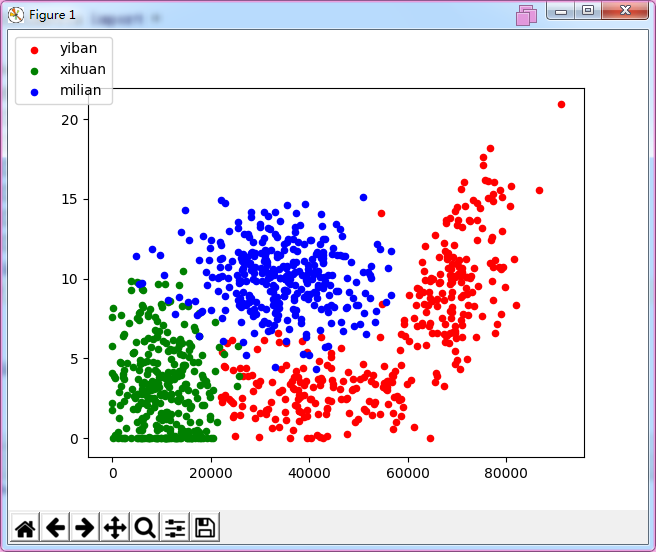
文件是drawapicture2.py
 1 import matplotlib
 2 import matplotlib.pyplot as plt
 3 import numpy
 4 from file2matrix import *
 5
 6 mat,labels=file2matrix("datingTestSet2.txt")
 7 nSizeofLabels=len(labels)
 8 mat1x=[]
 9 mat2x=[]
10 mat3x=[]
11 mat1y=[]
12 mat2y=[]
13 mat3y=[]
14 for i in range(nSizeofLabels):
15     if  labels[i]==1:
16         mat1x.append(mat[i][0])
17         mat1y.append(mat[i][1])
18     elif labels[i]==2:
19         mat2x.append(mat[i][0])
20         mat2y.append(mat[i][1])
21     elif  labels[i]==3:
22         mat3x.append(mat[i][0])
23         mat3y.append(mat[i][1])
24
25 fig=plt.figure()
26 ax=fig.add_subplot(111)
27 lg1=ax.scatter(mat1x,mat1y,s=20,c='red')
28 lg2=ax.scatter(mat2x,mat2y,s=20,c='green')
29 lg3=ax.scatter(mat3x,mat3y,s=20,c='blue')
30 fig.legend((lg1,lg2,lg3),('yiban','xihuan','milian'),"upper left")
31 plt.show()
结果是
=======================================================================
3 由于不同意义的数据的取值范围很大,所以需要归一化。
文件是matrixnormalization.py
 1 from  numpy import *
 2
 3 def autonorm(mat):
 4     minv=mat.min(0)
 5     maxv=mat.max(0)
 6     diff=maxv-minv
 7     rows=mat.shape[0]
 8     normmat=zeros(shape(mat))
 9     normmat=mat-tile(minv,(rows,1))
10     normmat=normmat/tile(diff,(rows,1))
11     return normmat,minv,maxv,diff
测试归一化
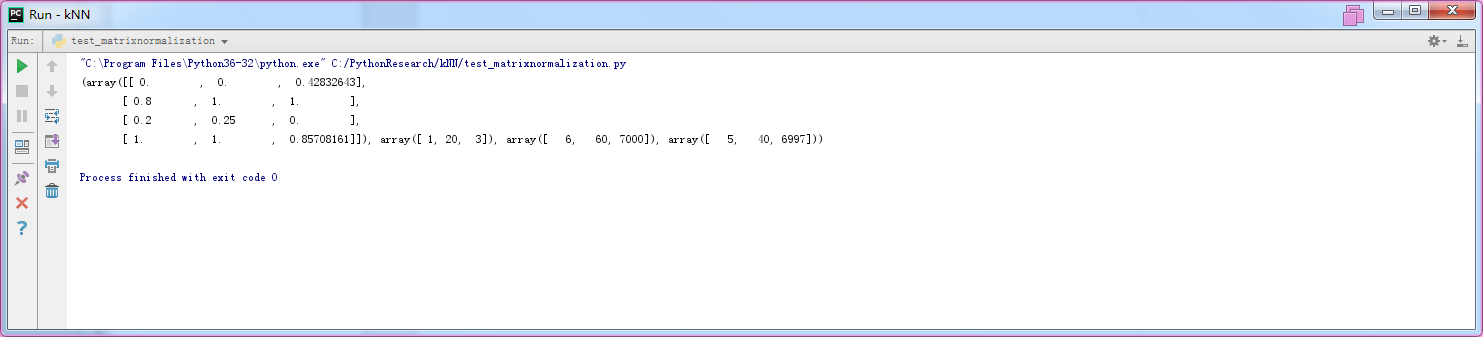
文件是test_matrixnormalization.py
1 from matrixnormalization import *
2
3
4 mat=array([[1,20,3000],[5,60,7000],[2,30,3],[6,60,6000]])
5 normmat=autonorm(mat)
6 print(normmat)
结果(不知道为何,跟书上的结果不太一样。)
=======================================================================
4测试一下这个分类器的效果
文件名test_dating.py
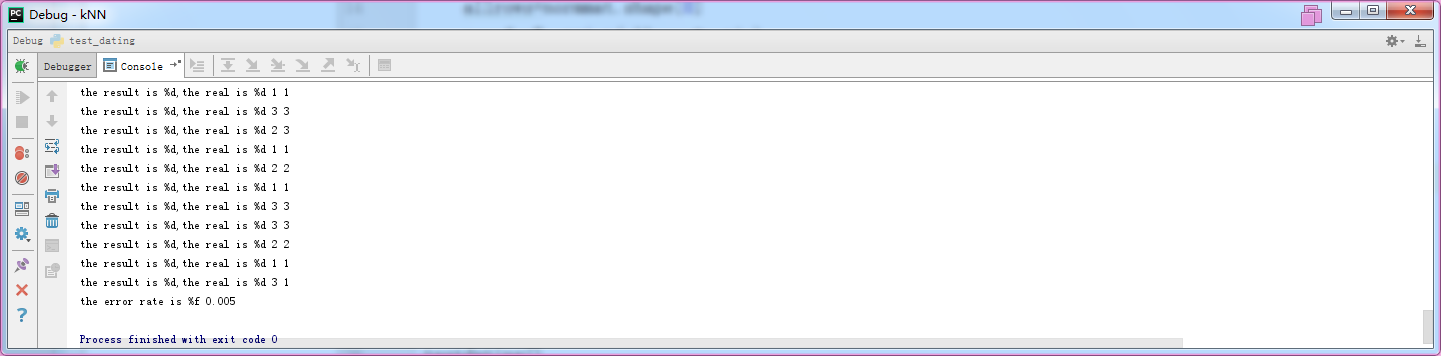
 1 from file2matrix import *
 2 from matrixnormalization import *
 3 from kNN import *
 4
 5
 6 def testdating():
 7     ratio=0.1
 8     countforerr=0
 9
10     mat,lab=file2matrix2("datingTestSet.txt")
11
12     normmat,minv,maxv,diff=autonorm(mat)
13
14     allrows=normmat.shape[0]
15     rowsforTest=int(allrows*ratio)
16
17     for i in range(rowsforTest):
18         res=classify_kNN(normmat[i,:],normmat[rowsforTest:allrows,:],lab[rowsforTest:allrows],3)
19         print('the result is',res,'the real is',lab[i])
20         if (res!=lab[i]):
21             countforerr+=1.0
22
23     print("the error rate is", (countforerr/float(allrows)))
24
25
26 testdating()
结果
=======================================================================
5支持手工输入
文件名test_dating2.py
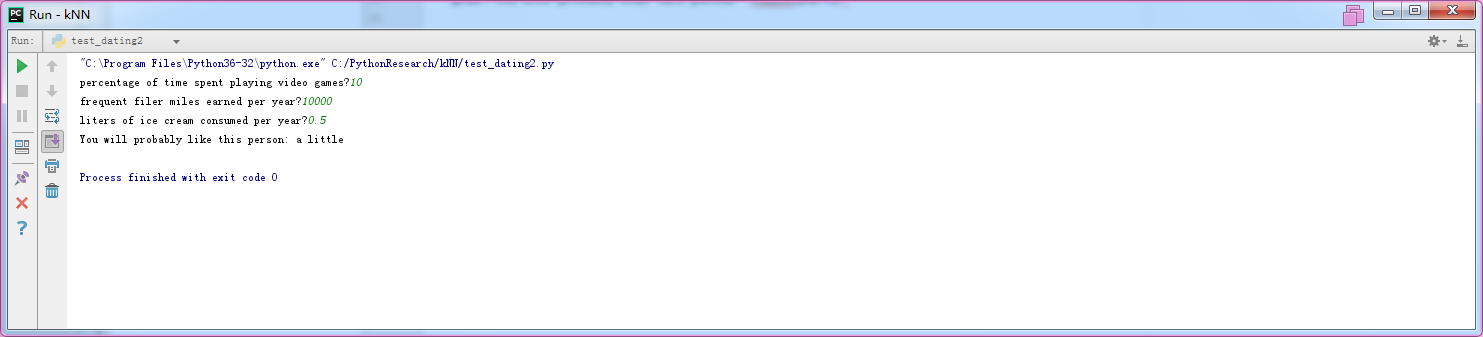
 1 from file2matrix import *
 2 from matrixnormalization import *
 3 from kNN import *
 4
 5
 6 def testdating():
 7     ratio=0.1
 8     countforerr=0
 9     reslist=["not at all","a little","very well"]
10     mat,lab=file2matrix2("datingTestSet.txt")
11
12     normmat,minv,maxv,diff=autonorm(mat)
13
14     allrows=normmat.shape[0]
15     rowsforTest=int(allrows*ratio)
16
17     percenttats=float(input("percentage of time spent playing video games?"))
18     flymiles=float(input("frequent filer miles earned per year?"))
19     icecream=float(input("liters of ice cream consumed per year?"))
20     desarr=array([flymiles,percenttats,icecream])
21     normdesarr=(desarr-minv)/diff
22
23     res=classify_kNN(normdesarr,normmat[rowsforTest:allrows,:],lab[rowsforTest:allrows],3)
24     print("You will probably like this person:",reslist[res-1])
25
26
27
28 testdating()
结果
=======================================================================
这一节更像是用一个小算法领着学习python。